National Health Interview Survey Early Release Program
NATIONAL CENTER FOR HEA LTH STATISTICS
National Health Interview Survey Early Release Program
NATIONAL CENTER FOR HEA LTH STATISTICS
Health Insurance Coverage: Early Release of Estimates From the
National Health Interview Survey, 2019
by Robin A. Cohen, Ph.D., Amy E. Cha, Ph.D., M.P.H., Michael E. Martinez, M.P.H., M.H.S.A., and Emily P. Terlizzi, M.P.H.
Division of Health Interview Statistics, National Center for Health Statistics
What’s New
Estimates of health insurance
coverage based on full year 2019
and 6-month intervals are
provided.
Highlights
In 2019, 33.2 million (10.3%)
persons of all ages were uninsured
at the time of interview. In the
second half of 2019, 35.7 million
persons of all ages (11.0%) were
uninsured—significantly higher
than the first 6 months of 2019
(30.7 million, 9.5%).
In 2019, among adults aged 18–
64, 14.7% were uninsured at the
time of interview, 20.4% had
public coverage, and 66.8% had
private health insurance coverage.
Among children aged 0–17 years,
5.1% were uninsured, 41.4% had
public coverage, and 55.2% had
private health insurance coverage.
Among adults aged 18–64, men
(16.3%) were more likely than
women (13.1%) to be uninsured.
Among adults aged 18–64,
Hispanic adults (29.7%) were
more likely than non-Hispanic
black (14.7%), non-Hispanic white
(10.5%) and non-Hispanic Asian
(7.5%) to be uninsured.
Among adults aged 18–64, 4.4%
(8.7 million) were covered by
private health insurance plans
obtained through the Health
Insurance Marketplace or state-
based exchanges.
This report presents full-year estimates of health insurance coverage for the civilian
noninstitutionalized U.S. population based on data from the January–December 2019
National Health Interview Survey (NHIS). These estimates are being published prior to
final editing and final weighting to provide access to the most recent information from
NHIS. Estimates are disaggregated by age group, sex, poverty status, race and
ethnicity, and state Medicaid expansion status. Estimates of exchange-based coverage
by sex, poverty status, and race and ethnicity are also included. Detailed appendix
tables contain all estimates presented in the figures, additional estimates by 6-month
intervals, and estimates for selected population characteristics.
In 2019, the NHIS questionnaire was redesigned to better meet the needs of data
users. See Technical Notes for more information on the potential impact of the
redesign on insurance estimates. Quarterly estimates for 2019 by age group and
poverty status, as well as more information about NHIS and the ER Program, are
available from the NHIS website at https://www.cdc.gov/nchs/nhis.htm.
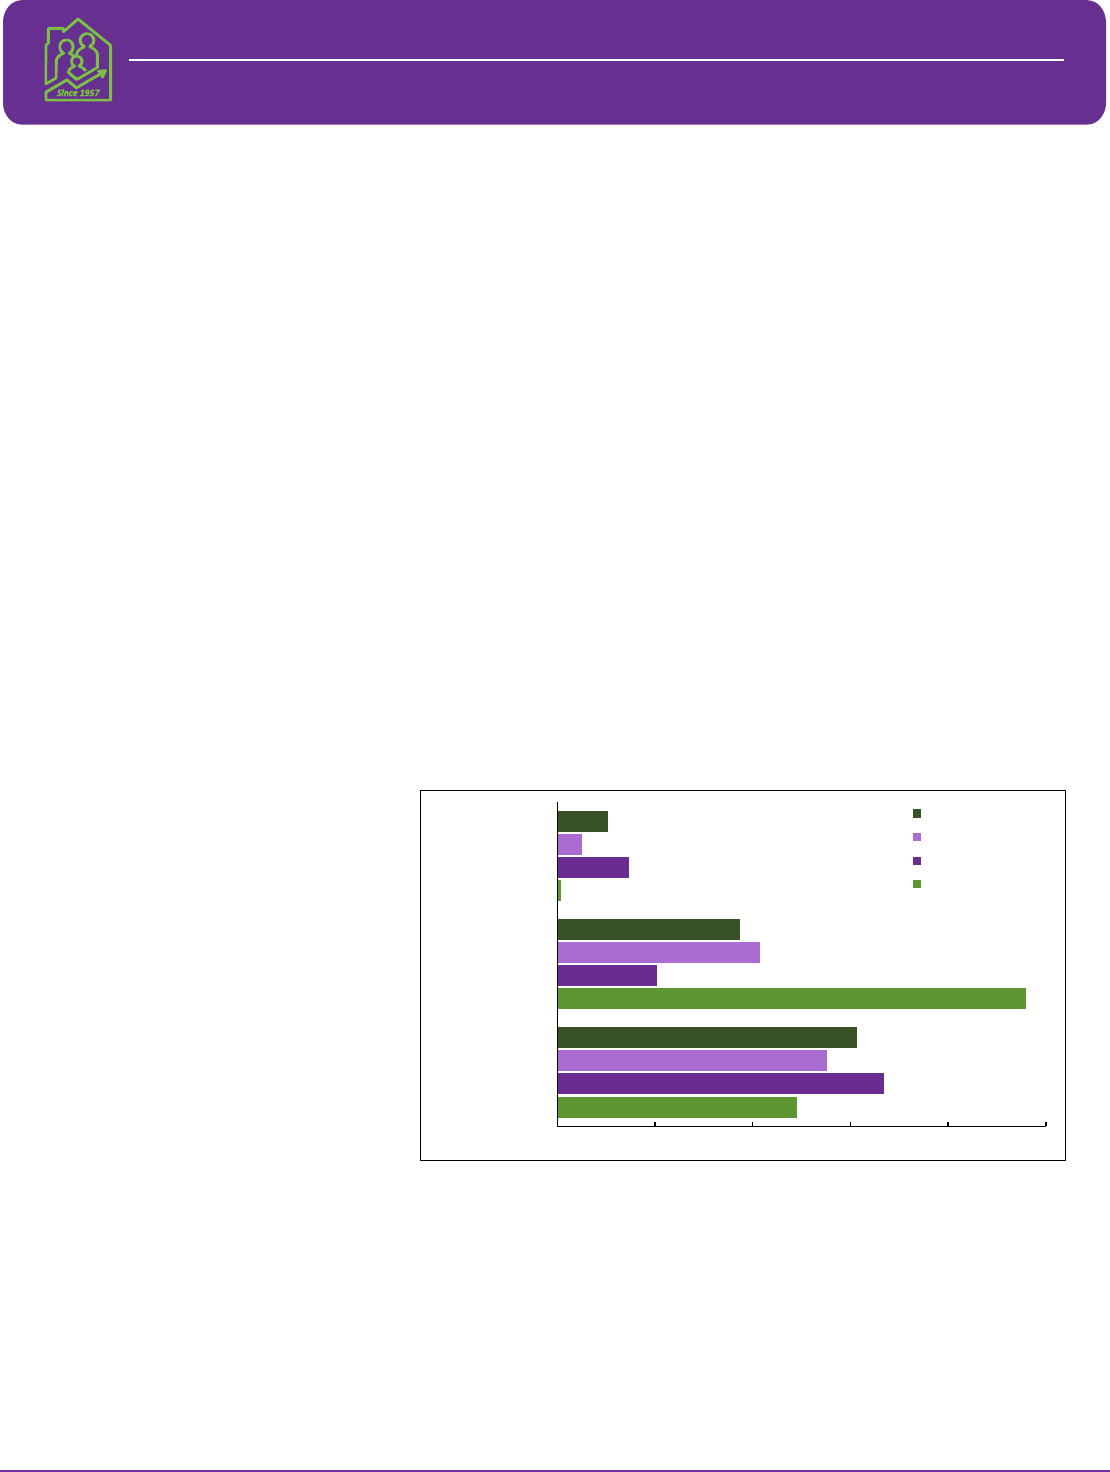
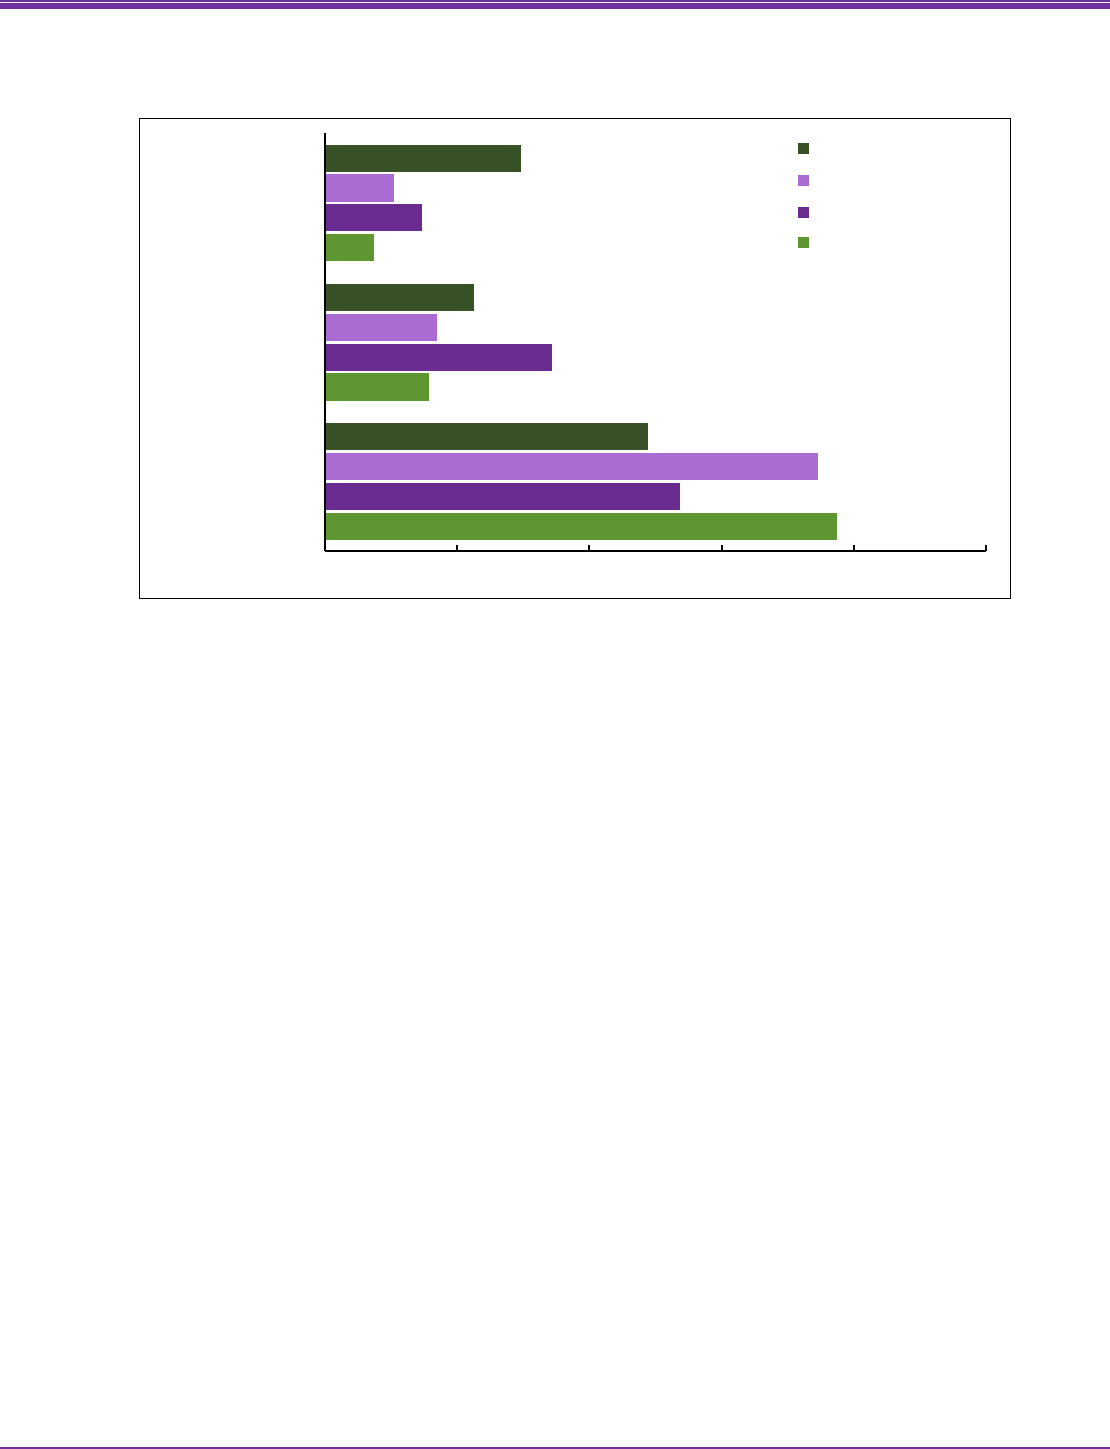
Figure 1. Percentages of persons who were uninsured or had public or private coverage at the
time of interview, by age group: United States, 2019
Uninsured
0.9
14.7
5.1
10.3
All persons
Children under 18
Adults 18–64
Adults 65 and over
Public coverage
20.4
41.4
37.4
96.0
Private coverage
49.1
66.8
55.2
61.3
0 20 40 60 80 100
NOTES: Persons were defined as uninsured if they did not have any private health insurance, Medicare, Medicaid, Children’s Health
Insurance Program (CHIP), state-sponsored or other government plan, or military plan. Persons were also defined as uninsured if they had
only Indian Health Service coverage or had only a private plan that paid for one type of service, such as accidents or dental care. Public
coverage includes Medicaid, CHIP, state-sponsored or other government-sponsored health plan, Medicare, and military plans. Private
coverage includes any comprehensive private insurance plan (including health maintenance and preferred provider organizations). These
plans include those obtained through an employer, purchased directly, purchased through local or community programs, or purchased
through the Health Insurance Marketplace or a state-based exchange. Private coverage excludes plans that pay for only one type of
service, such as accidents or dental care. A small number of persons were covered by both public and private plans and were included in
both categories. Data are based on household interviews of a sample of the civilian noninstitutionalized population.
SOURCE: National Center for Health Statistics, National Health Interview Survey, 2019.
Page | 1 U.S. Department of Health and Human Services ● Centers for Disease Control and Prevention ● National Center for Health Statistics ● Released 9/2020
Health Insurance Coverage: Early Release of Estimates From the National Health Interview Survey, 2019
In 2019, among persons of all ages, 10.3% were uninsured, 37.4% had public coverage, and 61.3% had private coverage at the time
of interview (Figure 1).
Adults aged 18–64 (14.7%) were the most likely to be uninsured, followed by children aged 0–17 years (5.1%), and adults aged 65
and over (0.9%).
Adults aged 65 and over (96.0%) were the most likely to have public coverage, followed by children aged 0–17 years (41.4%) and
adults aged 18–64 (20.4%).
Adults aged 18–64 (66.8%) were the most likely to have private coverage, followed by children aged 0–17 years (55.2%), and adults
aged 65 and over (49.1%).
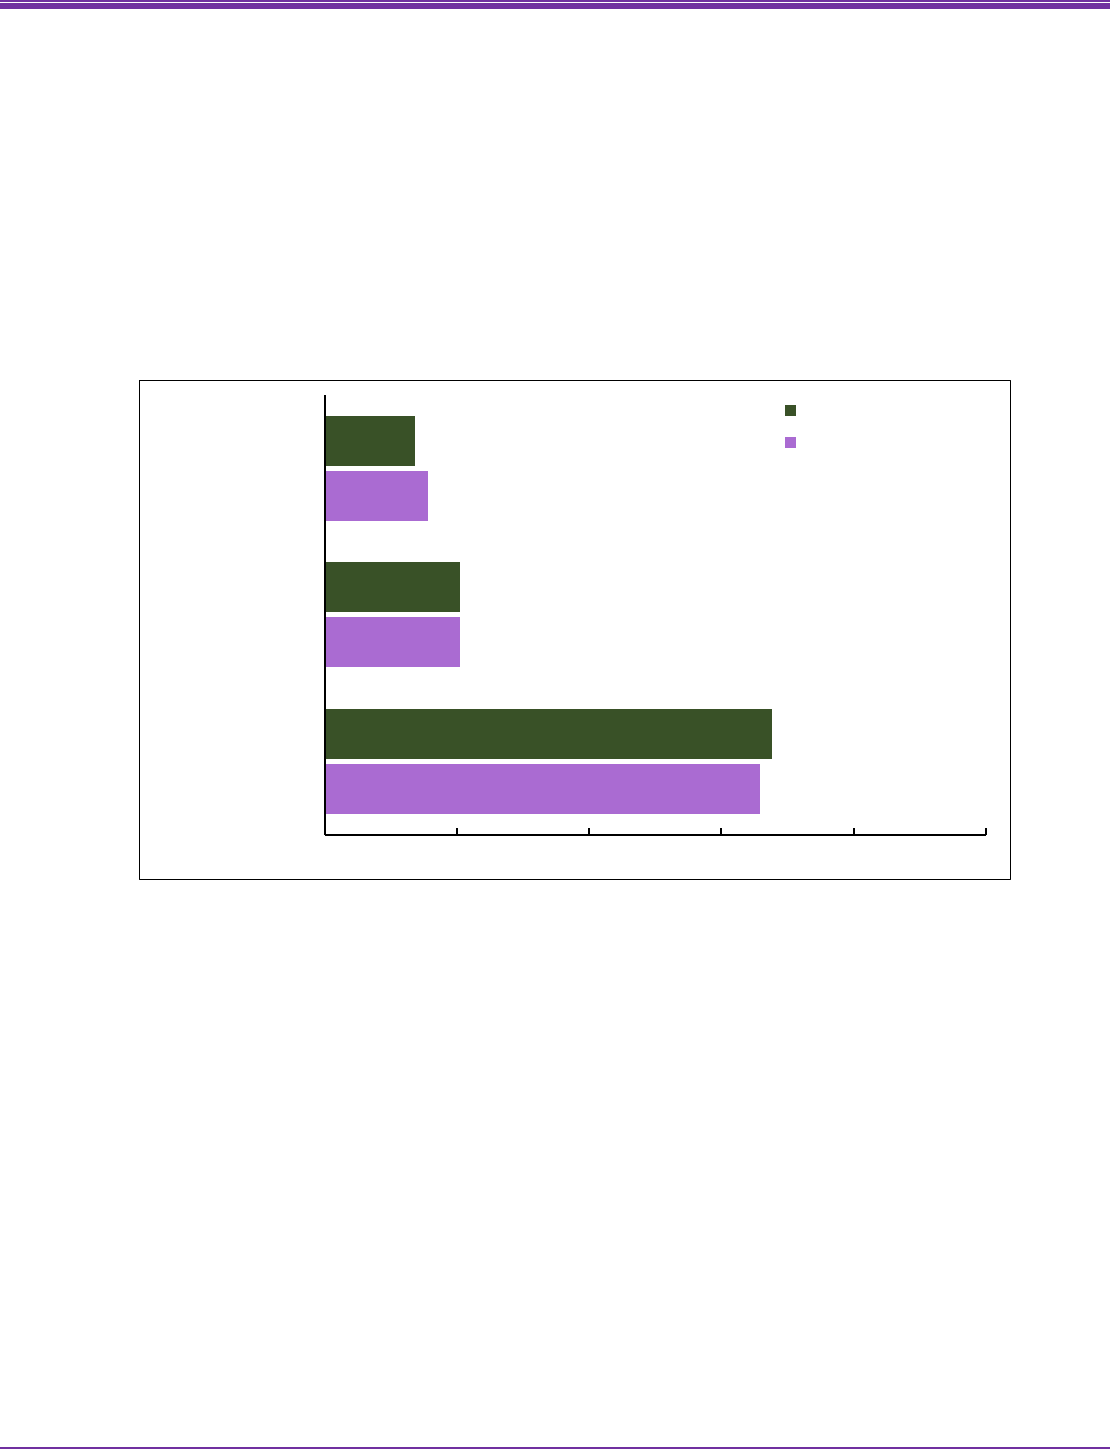
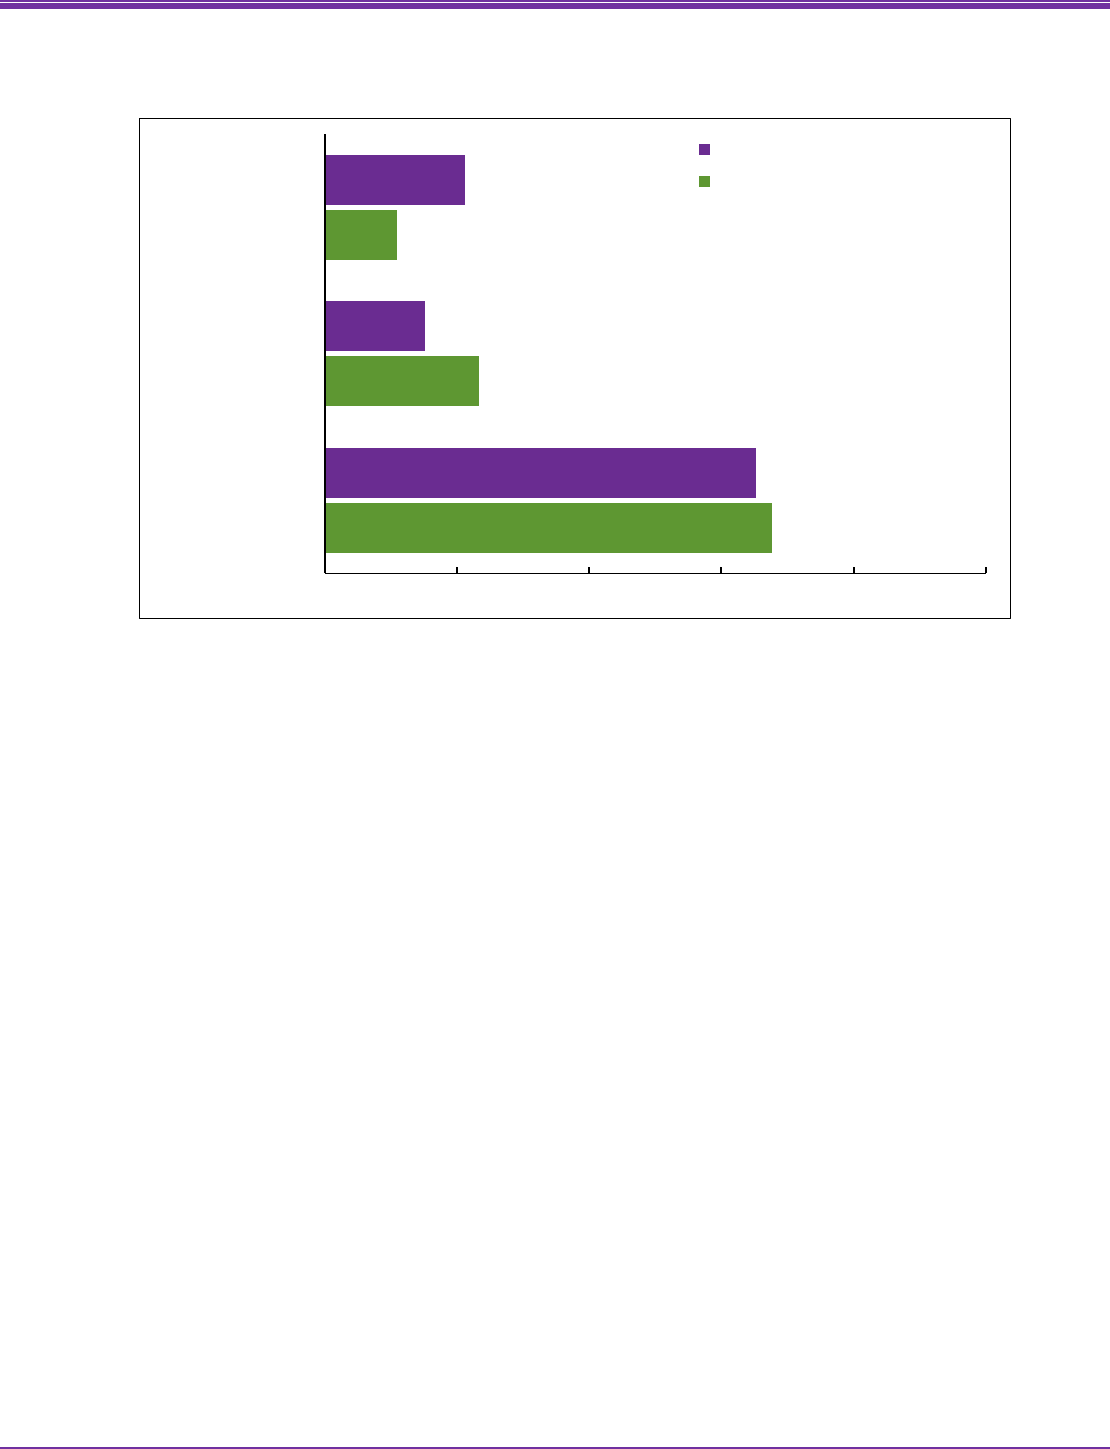
Figure 2. Percentages of adults aged 18–64 who were uninsured or had public or private
coverage at the time of interview, by 6-month interval: United States, January–December 2019
January–June, 2019
13.7
July–December, 2019
Uninsured
15.6
20.4
Public coverage
20.4
67.7
Private coverage
65.9
0 20 40 60 80 100
NOTES: Persons were defined as uninsured if they did not have any private health insurance, Medicare, Medicaid, Children’s Health
Insurance Program (CHIP), state-sponsored or other government plan, or military plan. Persons were also defined as uninsured if they had
only Indian Health Service coverage or had only a private plan that paid for one type of service, such as accidents or dental care. Public
coverage includes Medicaid, CHIP, state-sponsored or other government-sponsored health plan, Medicare, and military plans. Private
coverage includes any comprehensive private insurance plan (including health maintenance and preferred provider organizations). These
plans include those obtained through an employer, purchased directly, purchased through local or community programs, or purchased
through the Health Insurance Marketplace or a state-based exchange. Private coverage excludes plans that pay for only one type of
service, such as accidents or dental care. A small number of persons were covered by both public and private plans and were included in
both categories. Data are based on household interviews of a sample of the civilian noninstitutionalized population.
SOURCE: National Center for Health Statistics, National Health Interview Survey, 2019.
• Among adults aged 18–64, the percentage who were uninsured at the time of interview increased from 13.7% in January through
June 2019 to 15.6% in July through December 2019 (Figure 2).
• Among adults aged 18–64, the percentage who had public coverage at the time of interview did not change between January
through June 2019 (20.4%) and July through December 2019 (20.4%).
• Among adults aged 18–64, the percentage who had private coverage at the time of interview from January through June 2019
(67.7%) was significantly higher than July through December 2019 (65.9%).
Page | 2 U.S. Department of Health and Human Services ● Centers for Disease Control and Prevention ● National Center for Health Statistics ● Released 9/2020
Health Insurance Coverage: Early Release of Estimates From the National Health Interview Survey, 2019
Figure 3. Percentages of adults aged 18–64 who were uninsured or had public or private
coverage at the time of interview, by sex: United States, 2019
Men
16.3
Women
Uninsured
13.1
18.1
Public coverage
22.6
67.5
Private coverage
66.1
0 20 40 60 80 100
NOTES: Persons were defined as uninsured if they did not have any private health insurance, Medicare, Medicaid, Children’s Health
Insurance Program (CHIP), state-sponsored or other government plan, or military plan. Persons were also defined as uninsured if they had
only Indian Health Service coverage or had only a private plan that paid for one type of service, such as accidents or dental care. Public
coverage includes Medicaid, CHIP, state-sponsored or other government-sponsored health plan, Medicare, and military plans. Private
coverage includes any comprehensive private insurance plan (including health maintenance and preferred provider organizations). These
plans include those obtained through an employer, purchased directly, purchased through local or community programs, or purchased
through the Health Insurance Marketplace or a state-based exchange. Private coverage excludes plans that pay for only one type of
service, such as accidents or dental care. A small number of persons were covered by both public and private plans and were included in
both categories. Data are based on household interviews of a sample of the civilian noninstitutionalized population.
SOURCE: National Center for Health Statistics, National Health Interview Survey, 2019.
In 2019, among adults aged 18–64, men (16.3%) were more likely than women (13.1%) to be uninsured at the time of interview
(Figure 3).
Men (18.1%) were less likely than women (22.6%) to have public coverage at the time of interview.
The percentage of men (67.5%) with private coverage at the time of interview was higher than, but not significantly different
from, the percentage of women (66.1%) with private coverage at the time of interview.
Page | 3 U.S. Department of Health and Human Services ● Centers for Disease Control and Prevention ● National Center for Health Statistics ● Released 9/2020
Health Insurance Coverage: Early Release of Estimates From the National Health Interview Survey, 2019
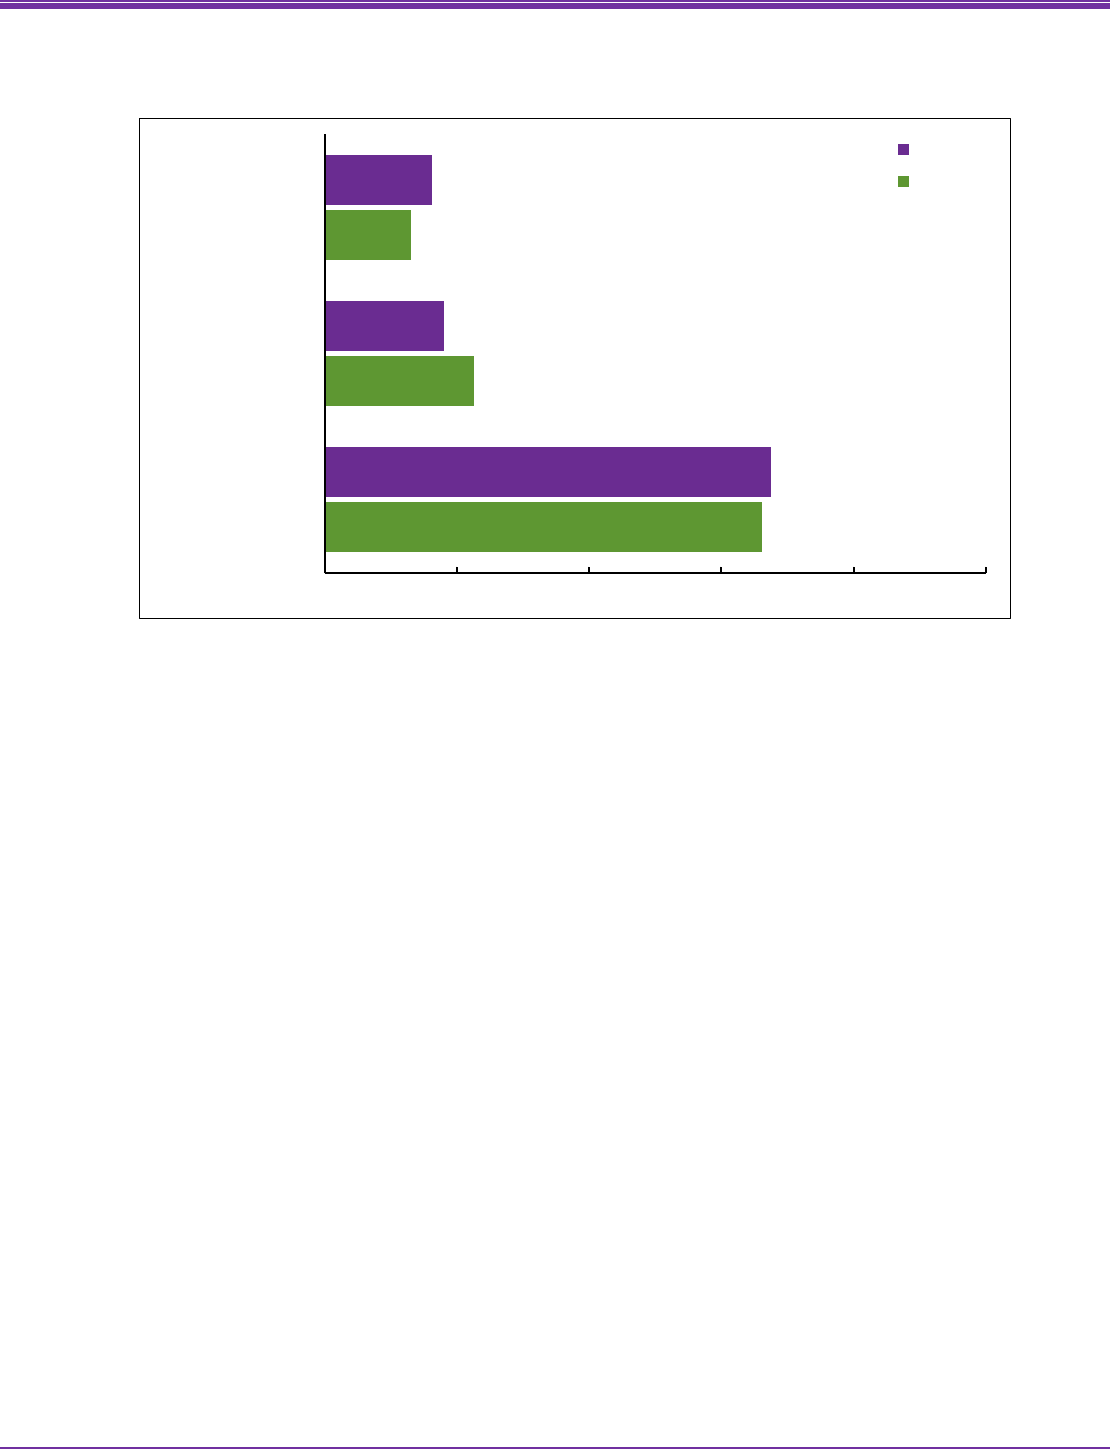
Figure 4. Percentages of adults aged 18–64 who were uninsured or had public or private
coverage at the time of interview, by poverty status: United States, 2019
Poor
25.8
Near poor
Uninsured
26.8
Not poor
9.0
52.3
Public coverage
35.4
10.4
23.6
Private coverage
40.1
82.4
0 20 40 60 80 100
NOTES: Poor persons were defined as those with incomes less than 100% of the federal poverty level (FPL); near-poor persons have
incomes 100% to less than 200% of the FPL; not-poor persons have incomes that are 200% of the FPL or greater. Persons were defined as
uninsured if they did not have any private health insurance, Medicare, Medicaid, Children’s Health Insurance Program (CHIP), state-
sponsored or other government plan, or military plan. Persons were also defined as uninsured if they had only Indian Health Service
coverage or had only a private plan that paid for one type of service, such as accidents or dental care. Public coverage includes Medicaid,
CHIP, state-sponsored or other government-sponsored health plan, Medicare, and military plans. Private coverage includes any
comprehensive private insurance plan (including health maintenance and preferred provider organizations). These plans include those
obtained through an employer, purchased directly, purchased through local or community programs, or purchased through the Health
Insurance Marketplace or a state-based exchange. Private coverage excludes plans that pay for only one type of service, such as accidents
or dental care. A small number of persons were covered by both public and private plans and were included in both categories. Data are
based on household interviews of a sample of the civilian noninstitutionalized population.
SOURCE: National Center for Health Statistics, National Health Interview Survey, 2019.
In 2019, among adults aged 18–64, the percentage who were uninsured at the time of interview was higher among those who were
poor (25.8%) and near poor (26.8%) compared with those who were not poor (9.0%) (Figure 4).
The percentage who had public coverage was highest among those who were poor (52.3), followed by those who were near poor
(35.4%) and those who were not poor (10.4%).
The percentage who had private coverage was lowest among those who were poor (23.6%), followed by those who were near poor
(40.1%) and those who were not poor (82.4%).
Page | 4 U.S. Department of Health and Human Services ● Centers for Disease Control and Prevention ● National Center for Health Statistics ● Released 9/2020
Health Insurance Coverage: Early Release of Estimates From the National Health Interview Survey, 2019
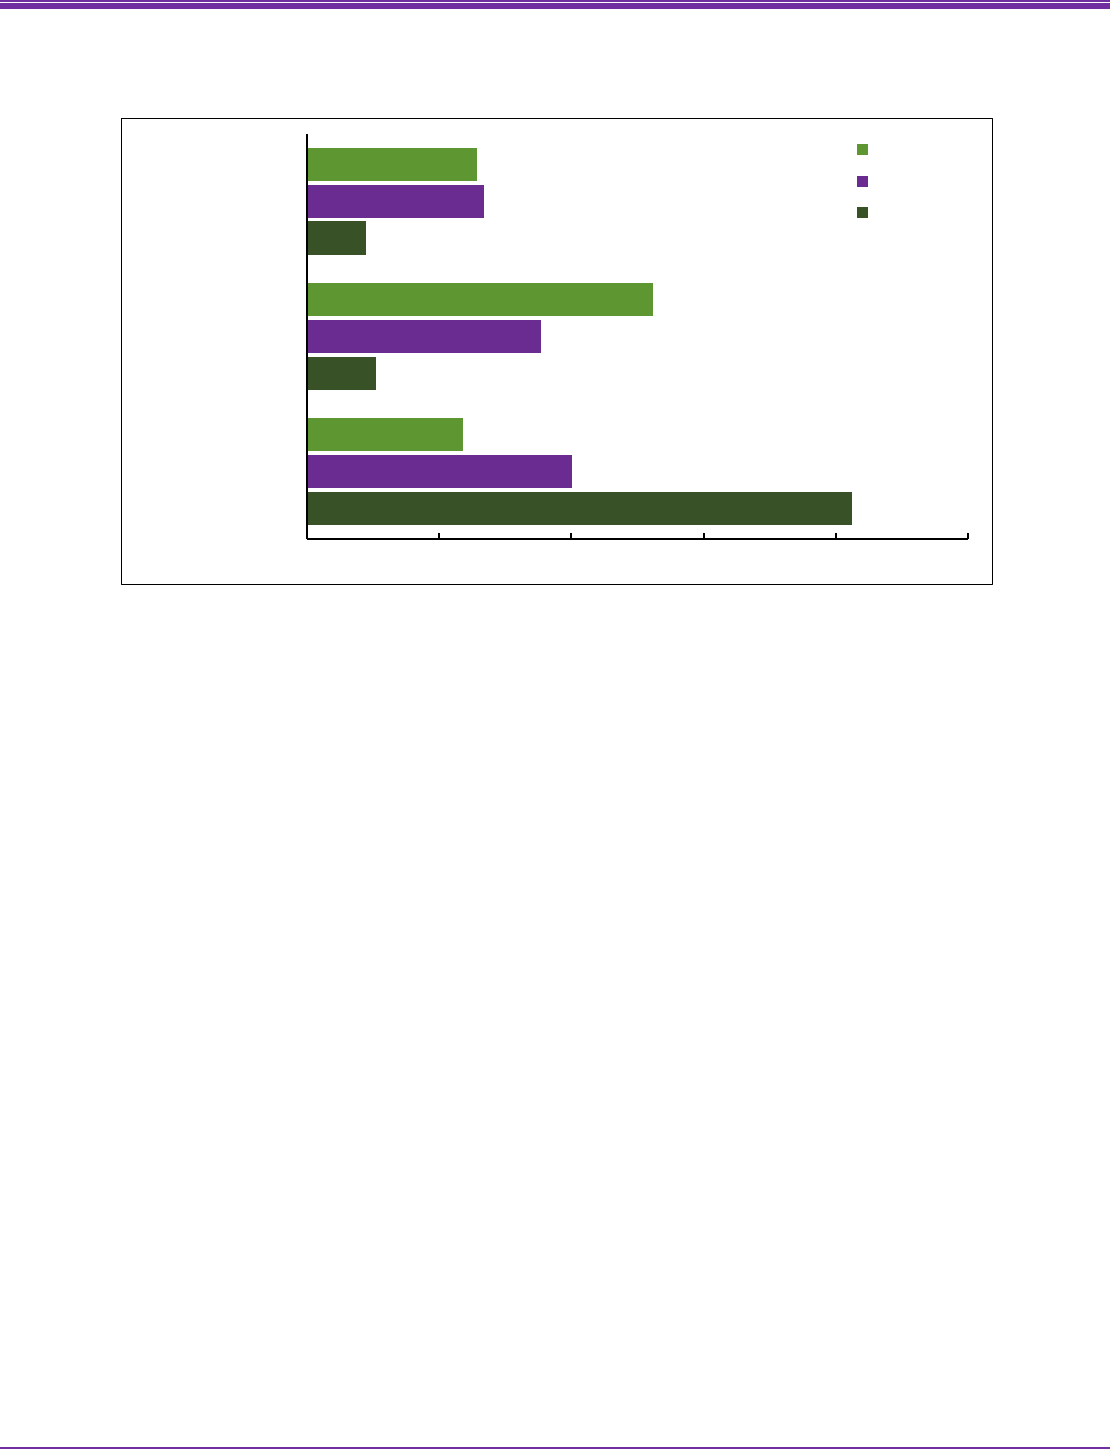
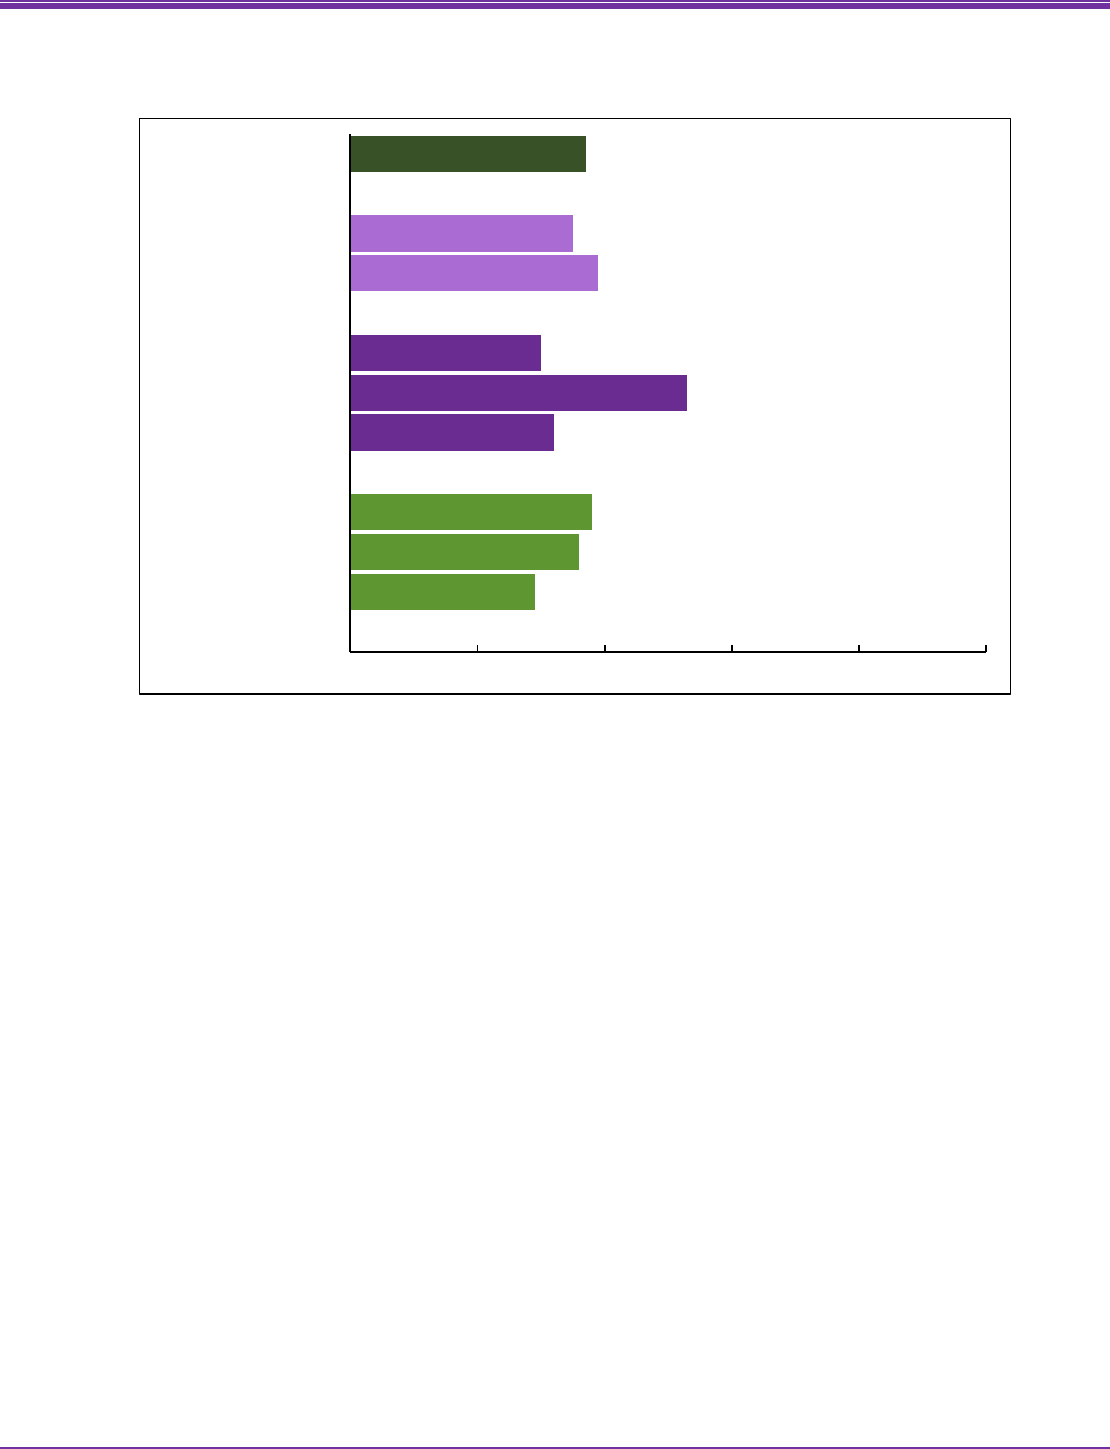
Figure 5. Percentages of adults aged 18–64 who were uninsured or had public or private
coverage at the time of interview, by race and ethnicity: United States, 2019
53.7
34.3
74.5
17.0
10.5
14.7
7.5
15.8
48.8
22.5
29.7
Private coverage
Public coverage
Uninsured
Hispanic
Non-Hispanic white
Non-Hispanic black
Non-Hispanic Asian
77.5
0 20 40 60 80 100
NOTES: Non-Hispanic adults of other races or multiple races were not included in the analysis. Persons were defined as uninsured if they
did not have any private health insurance, Medicare, Medicaid, Children’s Health Insurance Program (CHIP), state-sponsored or other
government plan, or military plan. Persons were also defined as uninsured if they had only Indian Health Service coverage or had only a
private plan that paid for one type of service, such as accidents or dental care. Public coverage includes Medicaid, CHIP, state-sponsored
or other government-sponsored health plan, Medicare, and military plans. Private coverage includes any comprehensive private
insurance plan (including health maintenance and preferred provider organizations). These plans include those obtained through an
employer, purchased directly, purchased through local or community programs, or purchased through the Health Insurance Marketplace
or a state-based exchange. Private coverage excludes plans that pay for only one type of service, such as accidents or dental care. A small
number of persons were covered by both public and private plans and were included in both categories. Data are based on household
inter
views of a sample of the civilian noninstitutionalizedpopulation.
SOURCE: National Center for Health Statistics, National Health Interview Survey, 2019.
In 2019, 29.7% of Hispanic, 14.7% of non-Hispanic black, 10.5% of non-Hispanic white, and 7.5% of non-Hispanic Asian adults
aged 18–64 were uninsured at the time of interview (Figure 5). Hispanic adults were the most likely to lack health insurance
coverage, followed by non-Hispanic black, non-Hispanic white, and non-Hispanic Asian adults.
Among adults aged 18–64, 34.3% of non-Hispanic black, 22.5% of Hispanic, 17.0% of non-Hispanic white, and 15.8% of non-
Hispanic Asian adults had public coverage at the time of interview. Non-Hispanic black adults were the most likely to have public
coverage, followed by Hispanic adults. Non-Hispanic white and non-Hispanic Asian adults were the least likely to have public
coverage.
Non-Hispanic Asian (77.5%) and non-Hispanic white (74.5%) adults were more likely than non-Hispanic black (53.7%) and
Hispanic (48.8%) adults to have private coverage at the time of interview. Non-Hispanic black adults were more likely have private
coverage than Hispanic adults.
Page | 5 U.S. Department of Health and Human Services ● Centers for Disease Control and Prevention ● National Center for Health Statistics ● Released 9/2020
Health Insurance Coverage: Early Release of Estimates From the National Health Interview Survey, 2019
Figure 6. Percentages of adults aged 18–64 who were uninsured or had public or private
coverage at the time of interview, by state Medicaid expansion status: United States, 2019
Non-Medicaid expansion states
21.2
Medicaid expansion states
Uninsured
11.0
15.1
Public coverage
23.4
65.3
Private coverage
67.6
0 20 40 60 80 100
NOTES: Persons were defined as uninsured if they did not have any private health insurance, Medicare, Medicaid, Children’s Health
Insurance Program (CHIP), state-sponsored or other government plan, or military plan. Persons were also defined as uninsured if they had
only Indian Health Service coverage or had only a private plan that paid for one type of service, such as accidents or dental care. Public
coverage includes Medicaid, CHIP, state-sponsored or other government-sponsored health plan, Medicare, and military plans. Private
coverage includes any comprehensive private insurance plan (including health maintenance and preferred provider organizations). These
plans include those obtained through an employer, purchased directly, purchased through local or community programs, or purchased
through the Health Insurance Marketplace or a state-based exchange. Private coverage excludes plans that pay for only one type of
service, such as accidents or dental care. A small number of persons were covered by both public and private plans and were included in
both ca
tegories. Data are based on household interviews of a sample of the civilian noninstitutionalized population.
SOURCE: National Center for Health Statistics, National Health Interview Survey, 2019.
In 2019, among adults aged 18–64, those living in non-Medicaid expansion states (21.2%) were about twice as likely as those
living in Medicaid expansion states (11.0%) to be uninsured at the time of interview (Figure 6).
Among adults aged 18–64, those living in non-Medicaid expansion states (15.1%) were less likely than those living in expansion
states (23.4%) to have public coverage at the time of interview.
Among adults aged 18–64, those living in non-Medicaid expansion states (65.3%) were less likely than those living in Medicaid
expansion states (67.6%) to have private coverage at the time of interview.
Page | 6 U.S. Department of Health and Human Services ● Centers for Disease Control and Prevention ● National Center for Health Statistics ● Released 9/2020
Health Insurance Coverage: Early Release of Estimates From the National Health Interview Survey, 2019
Figure 7. Percentage of persons under age 65 who had exchange-based private health
insurance coverage at the time of interview, by selected characteristics: United States, 2019
Total
Male
Female
Poor
Near poor
Not poor
Hispanic
Non-Hispanic white
Non-Hispanic black
2.9
3.6
3.8
3.2
5.3
3.0
3.9
3.5
3.7
0 2 4 6 8 10
NOTES: Poor persons were defined as those with incomes less than 100% of the federal poverty level (FPL); near-poor persons have
incomes 100% to less than 200% of the FPL; not-poor persons have incomes that are 200% of the FPL or greater. Exchange-based
coverage is a private health insurance plan purchased through the Health Insurance Marketplace or state-based exchanges that were
established as part of the Affordable Care Act (ACA) of 2010 ( P. L . 111–148, P. L . 111–152). Data are based on household interviews of a
sample of the civilian noninstitutionalized population.
SOURCE: National Center for Health Statistics, National Health Interview Survey, 2019.
In 2019, among persons under age 65, 3.7% were covered by exchange-based coverage (Figure 7).
Exchange-based coverage was higher among those who were near poor (5.3%) compared with those who were poor (3.0%) and
those who were not poor (3.2%).
Exchange-based coverage did not vary significantly by sex or race and ethnicity.
Page | 7 U.S. Department of Health and Human Services ● Centers for Disease Control and Prevention ● National Center for Health Statistics ● Released 9/2020

Health Insurance Coverage: Early Release of Estimates From the National Health Interview Survey, 2019
Technical Notes
All estimates in this report are based on preliminary data. The 2019 estimates are being released prior to final data editing and
final weighting to provide access to the most recent information from NHIS. Previously, differences between estimates calculated
using preliminary data files and final data files were typically less than 0.1 percentage point. In 2019, the NHIS questionnaire was
redesigned to better meet the needs of data users. The redesign aimed to improve the measurement of covered health topics, reduce
respondent burden by shortening the length of the questionnaire, harmonize overlapping content with other federal surveys, establish
a long-term structure of ongoing and periodic topics, and incorporate advances in survey methodology and measurement. For more
information about the redesigned NHIS, visit the website at: https://www.cdc.gov/nchs/nhis/2019_quest_redesign.htm.
Data source
Data used to produce this ER report are derived from the Sample Adult and Sample Child components from the January–
December 2019 NHIS. NHIS is a nationally representative household survey conducted throughout the year to collect information on
health status, health-related behaviors, and health care access and utilization. The NHIS interview begins by identifying everyone who
usually lives or stays in the household. Then, one “sample adult” aged 18 and over and one “sample child” aged 17 years and under (if
any children live in the household) are randomly selected. Information about the sample adults is collected from the sample adults
themselves unless they are physically or mentally unable to report, in which case a knowledgeable proxy can answer for them.
Information about the sample child is collected from a parent or adult who is knowledgeable about and responsible for the health care
of the sample child. This respondent may or may not also be the sample adult. Data analysis was based on information collected on
32,391 sample adults and 9,293 sample children. Visit the NHIS website at: https://www.cdc.gov/nchs/nhis.htm for more information
about the design, content, and use of NHIS.
Estimation procedures
The National Center for Health Statistics (NCHS) creates survey sampling weights to produce representative national estimates.
The base weight is equal to the inverse of the probability of selection of the sample address. In 2019, the adjustment method changed
to incorporate more robust multilevel models predictive of response propensity. Nonresponse-adjusted weights are further calibrated
to U.S. Census Bureau population projections and American Community Survey (ACS) 1-year estimates for age, sex, race and ethnicity,
educational attainment, census division, and metropolitan statistical area status. Prior to 2019, calibration was only to age, sex, and
race and ethnicity projections. These changes to the nonresponse adjustment approach and the calibration methods have the potential
to impact the weighted survey estimates. See the “2019 questionnaire redesign and comparison of estimates to earlier years” section
below and https://www.cdc.gov/nchs/nhis.htm for more details.
Point estimates and estimates of their variances were calculated using SUDAAN software (RTI International, Research Triangle
Park, N.C.) to account for the complex sample design of NHIS, taking into account stratum and primary sampling unit identifiers. The
Taylor series linearization method was chosen for variance estimation.
All estimates shown meet the NCHS standards of reliability as specified in “National Center for Health Statistics Data
Presentation Standards for Proportions” (1). All differences discussed are statistically significant unless otherwise noted. Differences
between percentages were evaluated using two-sided significance tests at the 0.05 level. Lack of comment regarding the difference
between any two estimates does not necessarily mean that the difference was tested and found to be not significant.
2019 questionnaire redesign and comparison of estimates to earlier years
In 2019, the NHIS questionnaire was redesigned to better meet the needs of data users. Due to changes in weighting and design
methodology, direct comparisons between estimates for 2019 and earlier years should be made with caution, as the impact of these
changes has not been fully evaluated at this time. A working paper entitled, “Preliminary Evaluation of the Impact of the 2019
National Health Interview Survey Questionnaire Redesign and Weighting Adjustments on Early Release Program Estimates,” available
from the Early Release Program homepage, discusses both these issues in greater detail for three indicators of insurance coverage (lack
of health insurance [uninsured], public health plan coverage, and private health insurance coverage). However, the discussion of these
health insurance indicators is limited to adults aged 18–64.
The increase in the percentage of adults aged 18–64 who were uninsured at the time of interview—from 13.3% in 2018 to 14.7%
in 2019—appears to be part of an increasing trend since 2016. The change in weighting approach may account for some (but not all)
of the increase between 2018 and 2019.
For public health plan coverage, the increase in the percentage of adults aged 18–64 who were covered by public coverage—from
19.4% in 2018 to 20.4% in 2019—appears to reverse a general decline since 2016. Questionnaire design and weighting adjustment
effects may have shifted estimates in opposing directions, leading to no overall impact. The increase observed between 2018 and 2019
is likely to reflect an actual change over time.
For private coverage, the decrease in the percentage of adults aged 18–64 who were covered by private coverage—from 68.9% in
2018 to 66.8% in 2019—appears to be part of a decreasing trend since 2015. Questionnaire design and weighting adjustment effects
Page | 8 U.S. Department of Health and Human Services ● Centers for Disease Control and Prevention ● National Center for Health Statistics ● Released 9/2020

Health Insurance Coverage: Early Release of Estimates From the National Health Interview Survey, 2019
may have shifted estimates in opposing directions, leading to no overall impact. The decrease observed between 2018 and 2019 is
likely to reflect an actual change over time.
References
1. Parker JD, Talih M, Malec DJ, Beresovsky V, Carroll M, Gonzalez Jr JF, et al. National Center for Health Statistics data
presentation standards for proportions. National Center for Health Statistics. Vital Health Stat 2(175). 2017. Available from:
https://www.cdc.gov/nchs/data/series/sr_02/sr02_175.pdf.
Suggested citation
Cohen RA, Cha AE, Martinez ME, Terlizzi EP. Health insurance coverage: Early release of estimates from the National Health Interview
Survey, 2019. National Center for Health Statistics. September 2020. Available from:
https://www.cdc.gov/nchs/nhis/healthinsurancecoverage.htm.
Page | 9 U.S. Department of Health and Human Services ● Centers for Disease Control and Prevention ● National Center for Health Statistics ● Released 9/2020

Health Insurance Coverage: Early Release of Estimates From the National Health Interview Survey, 2019
Table I. Percentages (and 95% confidence intervals) of persons who lacked health insurance coverage, had public health
plan coverage, and had private health insurance coverage at the time of interview, by age group and 6-month interval:
United States, 2019
Uninsured
1
at the time Public health plan Private health insurance
Age group (years) and 6-month interval
of interview coverage
2
coverage
3
All ages
2019 (full year)
10.3 (9.7–10.8) 37.4 (36.6–38.3) 61.3 (60.2–62.4)
Jan–Jun
9.5 (8.9–10.1) 37.4 (36.4–38.4) 62.1 (60.9–63.4)
Jul–Dec
11.0 (10.2–11.8) 37.5 (36.3–38.7) 60.5 (59.1–61.8)
Under 65
2019 (full year)
12.1 (11.4–12.8) 26.0 (25.1–26.9) 63.7 (62.5–64.8)
Jan–Jun 11.2 (10.5–11.9) 26.1 (25.0–27.2) 64.5 (63.2–65.8)
Jul–Dec
13.0 (12.1–13.9) 26.0 (24.9–27.1) 62.8 (61.4–64.3)
0–17
2019 (full year)
5.1 (4.5–5.7) 41.4 (39.8–43.0) 55.2 (53.4–57.0)
Jan–Jun 4.4 (3.7–5.0) 41.6 (39.7–43.5) 55.8 (53.8–57.8)
Jul–Dec
5.8 (5.0–6.7) 41.2 (39.2–43.2) 54.7 (52.4–57.0)
18–64
2019 (full year)
14.7 (13.9–15.4) 20.4 (19.6–21.2) 66.8 (65.7–67.9)
Jan–Jun 13.7 (12.9–14.6) 20.4 (19.4–21.4) 67.7 (66.5–69.0)
Jul–Dec
15.6 (14.6–16.7) 20.4 (19.2–21.6) 65.9 (64.5–67.2)
65 and over
2019 (full year)
0.9 (0.6–1.3) 96.0 (95.5–96.5) 49.1 (47.6–50.7)
Jan–Jun 0.7 (0.4–1.1) 96.0 (95.3–96.6) 49.8 (48.0–51.7)
Jul–Dec
1.0 (0.5–1.8) 96.0 (95.2–96.7) 48.4 (46.2–50.6)
1
Persons were defined as uninsured if they did not have any private health insurance, Medicare, Medicaid, Children’s Health Insurance Program (CHIP), state-sponsored
or other government-sponsored health plan, or military plan. Persons were also defined as uninsured if they had only Indian Health Service coverage or had only a
private plan that paid for one type of service, such as accidents or dental care.
2
Public health plan coverage includes Medicaid, CHIP, state-sponsored or other government-sponsored health plan, Medicare, and military plans. A small number of
persons were covered by both public and private plans and were included in both categories.
3
Private health insurance coverage includes any comprehensive private insurance plan (including health maintenance and preferred provider organizations). These
plans include those obtained through an employer, purchased directly, purchased through local or community programs, or purchased through the Health Insurance
Marketplace or a state-based exchange. Private coverage excludes plans that pay for only one type of service, such as accidents or dental care. A small number of
persons were covered by both public and private plans and were included in both categories.
NOTE: Data are based on household interviews of a sample of the civilian noninstitutionalized population.
SOURCE: National Center for Health Statistics, National Health Interview Survey, 2019.
Page | 10 U.S. Department of Health and Human Services ● Centers for Disease Control and Prevention ● National Center for Health Statistics ● Released 9/2020

Health Insurance Coverage: Early Release of Estimates From the National Health Interview Survey, 2019
Table II. Number (millions) of persons who lacked health insurance coverage, had public health plan coverage, and had
private health insurance coverage at the time of interview, by age group and 6-month interval: United States, 2019
Uninsured
1
at the time Public health plan Private health insurance
Age group (years) and 6-month interval
of interview coverage
2
coverage
3
All ages
2019 (full year)
33.2 121.4 198.7
Jan–Jun
30.7 121.0 201.0
Jul–Dec
35.7 121.7 196.2
Under 65
2019 (full year)
32.8 70.6 172.7
Jan–Jun 30.4 70.8 175.0
Jul–Dec
35.2 70.5 170.4
0–17
2019 (full year)
3.7 30.3 40.4
Jan–Jun 3.2 30.4 40.8
Jul–Dec
4.3 30.1 40.0
18–64
2019 (full year)
29.0 40.3 132.3
Jan–Jun 27.2 40.3 134.1
Jul–Dec
30.9 40.4 130.5
65 and over
2019 (full year)
0.5 50.8 26.0
Jan–Jun 0.4 50.2 26.1
Jul–Dec
0.5 51.2 25.8
1
Persons were defined as uninsured if they did not have any private health insurance, Medicare, Medicaid, Children’s Health Insurance Program (CHIP), state-sponsored
or other government-sponsored health plan, or military plan. Persons were also defined as uninsured if they had only Indian Health Service coverage or had only a
private plan that paid for one type of service, such as accidents or dental care.
2
Public health plan coverage includes Medicaid, CHIP, state-sponsored or other government-sponsored health plan, Medicare, and military plans. A small number of
persons were covered by both public and private plans and were included in both categories.
3
Private health insurance coverage includes any comprehensive private insurance plan (including health maintenance and preferred provider organizations). These
plans include those obtained through an employer, purchased directly, purchased through local or community programs, or purchased through the Health Insurance
Marketplace or a state-based exchange. Private coverage excludes plans that pay for only one type of service, such as accidents or dental care. A small number of
persons were covered by both public and private plans and were included in both categories.
NOTE: Data are based on household interviews of a sample of the civilian noninstitutionalized population.
SOURCE: National Center for Health Statistics, National Health Interview Survey, 2019.
Page | 11 U.S. Department of Health and Human Services ● Centers for Disease Control and Prevention ● National Center for Health Statistics ● Released 9/2020

Health Insurance Coverage: Early Release of Estimates From the National Health Interview Survey, 2019
Table III. Percentages (and 95% confidence intervals) of persons under age 65 who lacked health insurance coverage, had
public health plan coverage, and had private health insurance coverage at the time of interview, by sex, age group, and
6-month interval: United States, 2019
Uninsured
1
at the time Public health plan Private health
Sex, age group (years), and 6-month interval
of interview coverage
2
insurance coverage
3
Male
Under 65
2019 (full year) 13.2 (12.3–14.1) 24.7 (23.6–25.9) 63.9 (62.4–65.4)
Jan–Jun 12.4 (11.5–13.5) 25.0 (23.7–26.4) 64.3 (62.7–65.9)
Jul–Dec 13.9 (12.6–15.2) 24.4 (23.0–25.9) 63.5 (61.6–65.4)
0–17
2019 (full year) 5.1 (4.4–5.8) 42.1 (40.1–44.2) 54.5 (52.2–56.7)
Jan–Jun 4.7 (3.8–5.6) 42.8 (40.4–45.3) 54.1 (51.5–56.6)
Jul–Dec 5.5 (4.4–6.7) 41.4 (38.7–44.1) 54.9 (52.0–57.7)
18–64
2019 (full year) 16.3 (15.1–17.4) 18.1 (17.0–19.2) 67.5 (66.1–69.0)
Jan–Jun 15.4 (14.2–16.7) 18.2 (16.9–19.6) 68.3 (66.5–70.0)
Jul–Dec 17.1 (15.5–18.8) 17.9 (16.4–19.6) 66.8 (64.8–68.8)
Female
Under 65
2019 (full year) 11.0 (10.4–11.7) 27.3 (26.2–28.4) 63.4 (62.2–64.7)
Jan–Jun 10.0 (9.2–10.7) 27.1 (25.7–28.5) 64.7 (63.1–66.3)
Jul–Dec 12.1 (11.1–13.1) 27.6 (26.2–28.9) 62.2 (60.6–63.7)
0–17
2019 (full year) 5.1 (4.4–6.0) 40.6 (38.5–42.8) 56.0 (53.8–58.2)
Jan–Jun 4.0 (3.2–5.0) 40.3 (37.6–43.1) 57.6 (55.0–60.2)
Jul–Dec 6.2 (5.0–7.6) 41.0 (38.1–43.9) 54.4 (51.5–57.4)
18–64
2019 (full year) 13.1 (12.4–13.9) 22.6 (21.6–23.6) 66.1 (64.9–67.3)
Jan–Jun 12.1 (11.1–13.1) 22.4 (21.1–23.8) 67.2 (65.6–68.8)
Jul–Dec 14.2 (13.1–15.3) 22.8 (21.4–24.2) 64.9 (63.4–66.4)
1
Persons were defined as uninsured if they did not have any private health insurance, Medicare, Medicaid, Children’s Health Insurance Program (CHIP), state-sponsored
or other government-sponsored health plan, or military plan. Persons were also defined as uninsured if they had only Indian Health Service coverage or had only a
private plan that paid for one type of service, such as accidents or dental care.
2
Public health plan coverage includes Medicaid, CHIP, state-sponsored or other government-sponsored health plan, Medicare, and military plans. A small number of
persons were covered by both public and private plans and were included in both categories.
3
Private health insurance coverage includes any comprehensive private insurance plan (including health maintenance and preferred provider organizations). These
plans include those obtained through an employer, purchased directly, purchased through local or community programs, or purchased through the Health Insurance
Marketplace or a state-based exchange. Private coverage excludes plans that pay for only one type of service, such as accidents or dental care. A small number of
persons were covered by both public and private plans and were included in both categories.
NOTE: Data are based on household interviews of a sample of the civilian noninstitutionalized population.
SOURCE: National Center for Health Statistics, National Health Interview Survey, 2019.
Page | 12 U.S. Department of Health and Human Services ● Centers for Disease Control and Prevention ● National Center for Health Statistics ● Released 9/2020

Health Insurance Coverage: Early Release of Estimates From the National Health Interview Survey, 2019
Table IV. Percentages (and 95% confidence intervals) of persons under age 65 who lacked health insurance coverage, had
public health plan coverage, and had private health insurance coverage at the time of interview, by poverty status, age
group, and 6-month interval: United States, 2019
Poverty status
1
, age group (years), and 6-month Uninsured
2
at the time Public health plan Private health
interval of interview coverage
3
insurance coverage
4
Poor
Under 65
2019 (full year) 18.3 (16.2–20.5) 65.3 (63.0–67.5) 18.2 (16.3–20.3)
Jan–Jun 15.5 (13.2–18.1) 68.5 (65.2–71.7) 17.6 (14.6–20.9)
Jul–Dec 20.9 (18.1–23.8) 62.2 (58.9–65.4) 18.9 (16.4–21.5)
0–17
2019 (full year) 5.1 (3.8–6.8) 87.8 (85.3–90.1) 8.9 (7.1–11.1)
Jan–Jun 3.4 (1.7–6.1) 90.4 (86.8–93.3) 7.9 (5.2–11.2)
Jul–Dec 6.8 (4.7–9.4) 85.4 (81.1–89.0) 9.9 (7.0–13.6)
18–64
2019 (full year) 25.8 (23.0–28.9) 52.3 (49.4–55.1) 23.6 (20.9–26.5)
Jan–Jun 22.6 (19.1–26.3) 55.8 (51.7–59.8) 23.2 (19.0–27.9)
Jul–Dec 28.8 (25.2–32.7) 49.1 (45.3–52.9) 23.9 (20.9–27.1)
Near poor
Under 65
2019 (full year) 20.1 (18.6–21.6) 47.0 (45.1–48.9) 35.4 (33.6–37.2)
Jan–Jun 18.7 (16.5–21.0) 47.6 (45.1–50.0) 36.4 (33.8–39.0)
Jul–Dec 21.5 (19.2–23.9) 46.4 (43.6–49.2) 34.3 (32.1–36.6)
0–17
2019 (full year) 6.5 (5.2–8.0) 70.3 (67.7–72.8) 25.8 (23.1–28.5)
Jan–Jun 6.1 (4.5–8.0) 69.8 (65.8–73.6) 27.1 (23.0–31.6)
Jul–Dec 7.0 (5.1–9.2) 70.8 (66.6–74.8) 24.3 (21.0–27.9)
18–64
2019 (full year) 26.8 (24.9–28.8) 35.4 (33.3–37.5) 40.1 (38.3–42.0)
Jan–Jun 25.1 (22.2–28.2) 36.2 (33.6–38.9) 41.1 (38.6–43.6)
Jul–Dec 28.5 (25.8–31.4) 34.6 (31.6–37.7) 39.2 (36.6–41.9)
Not poor
Under 65
2019 (full year) 7.9 (7.3–8.4) 11.8 (11.2–12.5) 82.0 (81.1–82.8)
Jan–Jun 7.4 (6.8–8.0) 11.6 (10.8–12.4) 82.7 (81.7–83.6)
Jul–Dec 8.4 (7.6–9.3) 12.1 (11.2–13.0) 81.2 (79.9–82.5)
0–17
2019 (full year) 4.3 (3.6–5.1) 16.3 (14.9–17.8) 80.7 (79.1–82.2)
Jan–Jun 3.7 (3.0–4.5) 16.1 (14.5–17.9) 81.5 (79.7–83.2)
Jul–Dec 4.9 (3.9–6.2)
16.6 (14.8–18.4) 79.9 (77.7–81.9)
18–64
2019 (full year) 9.0 (8.4–9.6) 10.4 (9.8–11.0) 82.4 (81.6–83.2)
Jan–Jun 8.5 (7.9–9.2) 10.2 (9.4–11.0) 83.1 (82.1–84.1)
Jul–Dec 9.5 (8.6–10.6) 10.6 (9.8–11.5) 81.6 (80.4–82.9)
1
Poverty categories are based on the ratio of the family’s income in the previous calendar year to the appropriate poverty threshold (given the family’s size and
number of children), as defined by the U.S. Census Bureau for that year (Semega JL, Kollar MA, Creamer J, Mohanty A. Income and poverty in the United States: 2018.
Current Population Reports, P60–266. 2019). Poor persons were defined as those with incomes less than 100% of the federal poverty level (FPL); near-poor persons
have incomes 100% to less than 200% of the FPL; not-poor persons have incomes that are 200% of the FPL or greater. The percentage of respondents under age 65
with unknown poverty status in 2019 was 7.6%. Persons with unknown poverty status are not shown in this table. Estimates may differ from estimates that are based
on both reported and imputed income.
2
Persons were defined as uninsured if they did not have any private health insurance, Medicare, Medicaid, Children’s Health Insurance Program (CHIP), state-sponsored
or other government-sponsored health plan, or military plan. Persons were also defined as uninsured if they had only Indian Health Service coverage or had only a
private plan that paid for one type of service, such as accidents or dental care.
3
Public health plan coverage includes Medicaid, CHIP, state-sponsored or other government-sponsored health plan, Medicare, and military plans. A small number of
persons were covered by both public and private plans and were included in both categories.
4
Private health insurance coverage includes any comprehensive private insurance plan (including health maintenance and preferred provider organizations). These
plans include those obtained through an employer, purchased directly, purchased through local or community programs, or purchased through the Health Insurance
Marketplace or a state-based exchange. Private coverage excludes plans that pay for only one type of service, such as accidents or dental care. A small number of
persons were covered by both public and private plans and were included in both categories.
NOTE: Data are based on household interviews of a sample of the civilian noninstitutionalized population.
SOURCE: National Center for Health Statistics, National Health Interview Survey, 2019.
Page | 13 U.S. Department of Health and Human Services ● Centers for Disease Control and Prevention ● National Center for Health Statistics ● Released 9/2020

Health Insurance Coverage: Early Release of Estimates From the National Health Interview Survey, 2019
Table V. Percentages (and 95% confidence intervals) of persons under age 65 who lacked health insurance coverage, had
public health plan coverage, and had private health insurance coverage at the time of interview, by race and ethnicity,
age group, and 6-month interval: United States, 2019
Race and ethnicity
1
, age group (years), and 6-month Uninsured
2
at the time Public health plan Private health
interval of interview coverage
3
insurance coverage
4
Hispanic
Under 65
2019 (full year) 22.1 (20.3–23.9) 34.7 (32.7–36.7) 44.3 (42.1–46.4)
Jan–Jun 20.0 (18.1–22.1) 35.0 (32.7–37.4) 45.8 (43.7–47.9)
Jul–Dec 24.1 (21.6–26.8) 34.4 (31.8–37.0) 42.7 (39.6–45.9)
0–17
2019 (full year) 7.2 (6.0–8.6) 58.7 (55.9–61.5) 35.4 (32.7–38.1)
Jan–Jun 6.0 (4.6–7.7) 60.1 (56.8–63.4) 34.9 (32.0–38.0)
Jul–Dec 8.4 (6.8–10.2) 57.2 (52.9–61.5) 35.8 (31.9–39.8)
18–64
2019 (full year) 29.7 (27.4–32.0) 22.5 (20.4–24.7) 48.8 (46.5–51.1)
Jan–Jun 27.2 (24.6–29.9) 22.2 (19.5–25.2) 51.4 (49.0–53.8)
Jul–Dec 32.1 (28.7–35.6) 22.8 (20.3–25.5) 46.2 (42.8–49.6)
Non-Hispanic white
Under 65
2019 (full year) 9.0 (8.4–9.7) 19.6 (18.7–20.7) 73.3 (72.2–74.3)
Jan–Jun 8.4 (7.7–9.1) 20.0 (18.9–21.1) 73.6 (72.4–74.8)
Jul–Dec 9.7 (8.8–10.6) 19.3 (18.0–20.7) 72.9 (71.4–74.4)
0–17
2019 (full year) 4.5 (3.7–5.4) 27.9 (26.1–29.8) 69.3 (67.4–71.1)
Jan–Jun 3.8 (3.0–4.7) 28.3 (26.3–30.5) 69.6 (67.5–71.7)
Jul–Dec 5.2 (4.0–6.7) 27.5 (25.1–30.0) 68.9 (66.3–71.4)
18–64
2019 (full year) 10.5 (9.8–11.2) 17.0 (16.1–18.0) 74.5 (73.5–75.5)
Jan–Jun 9.8 (9.1–10.7) 17.4 (16.3–18.5) 74.8 (73.6–76.1)
Jul–Dec 11.1 (10.1–12.1) 16.7 (15.4–18.1) 74.2 (72.8–75.6)
Non-Hispanic black
Under 65
2019 (full year) 11.6 (10.2–13.0) 42.8 (40.0–45.6) 48.5 (46.0–50.9)
Jan–Jun 10.7 (9.1–12.4) 41.9 (38.9–44.9) 50.4 (47.2–53.7)
Jul–Dec 12.4 (10.3–14.8) 43.7 (39.9–47.5) 46.5 (43.5–49.6)
0–17
2019 (full year) 3.5 (2.5–4.9) 64.5 (60.1–68.7) 35.1 (31.1–39.3)
Jan–Jun 3.2 (1.7–5.5)
61.0 (55.0–66.7) 39.3 (33.7–45.1)
Jul–Dec 3.9 (2.3–6.0) 68.1 (61.8–73.9) 30.8 (25.1–37.0)
18–64
2019 (full year) 14.7 (12.9–16.7) 34.3 (31.5–37.1) 53.7 (51.3–56.0)
Jan–Jun 13.6 (11.7–15.8) 34.2 (31.5–36.9) 54.9 (51.8–57.9)
Jul–Dec 15.7 (12.8–18.8) 34.5 (30.6–38.5) 52.5 (49.3–55.7)
See footnotes at the end of table.
Page | 14 U.S. Department of Health and Human Services ● Centers for Disease Control and Prevention ● National Center for Health Statistics ● Released 9/2020

Health Insurance Coverage: Early Release of Estimates From the National Health Interview Survey, 2019
Table V. Percentages (and 95% confidence intervals) of persons under age 65 who lacked health insurance coverage, had
public health plan coverage, and had private health insurance coverage at the time of interview, by race and ethnicity,
age group, and 6-month interval: United States, 2019—cont.
Race and ethnicity
1
, age group (years), and 6-month Uninsured
2
at the time Public health plan Private health
interval of interview coverage
3
insurance coverage
4
Non-Hispanic Asian
Under 65
2019 (full year) 6.6 (5.0–8.7) 17.5 (15.1–20.2) 76.6 (73.5–79.5)
Jan–Jun 6.2 (3.7–9.7) 17.1 (14.0–20.7) 77.4 (73.4–81.0)
Jul–Dec 7.1 (4.5–10.5) 17.9 (14.0–22.4) 75.8 (70.9–80.2)
0–17
2019 (full year) 3.2 (1.6–5.7) 24.1 (19.6–29.1) 73.2 (68.2–77.8)
Jan–Jun * 23.1 (18.0–28.9) 75.5 (69.6–80.8)
Jul–Dec * 25.2 (17.4–34.3) 70.8 (61.5–78.9)
18–64
2019 (full year) 7.5 (5.6–9.9) 15.8 (13.2–18.7) 77.5 (74.2–80.5)
Jan–Jun 7.4 (4.4–11.6) 15.5 (12.0–19.7) 77.9 (73.1–82.1)
Jul–Dec 7.6 (4.7–11.6) 16.1 (12.5–20.2) 77.1 (72.6–81.2)
Non-Hispanic, other races and multiple races
Under 65
2019 (full year) 14.6 (11.4–18.2) 34.5 (28.9–40.3) 52.9 (46.7–59.0)
Jan–Jun 15.6 (11.5–20.4) 33.4 (28.0–39.2) 52.6 (46.2–58.9)
Jul–Dec 13.5 (9.6–18.2) 35.6 (28.3–43.4) 53.2 (45.1–61.2)
0–17
2019 (full year) 5.9 (3.5–9.3) 45.3 (38.0–52.8) 50.4 (42.6–58.3)
Jan–Jun 6.6 (3.2–11.8) 45.6 (37.9–53.6) 49.5 (41.1–57.9)
Jul–Dec * 44.9 (34.5–55.6) 51.5 (40.9–62.0)
18–64
2019 (full year) 21.1 (17.0–25.8) 26.2 (20.6–32.5) 54.8 (48.1–61.3)
Jan–Jun 22.9 (17.1–29.5) 23.5 (18.1–29.5) 55.1 (47.5–62.5)
Jul–Dec 19.4 (14.1–25.6) 29.0 (21.4–37.5) 54.4 (45.5–63.1)
*
Estimate is not shown, as it does not meet NCHS standards of reliability.
1
Hispanic origin and race are two separate and distinct categories. Persons of Hispanic or Latino origin may be of any race or combination of races. Hispanic or Latino
origin includes persons of Mexican, Puerto Rican, Cuban, Central and South American, or Spanish origin. Race is based on a respondent’s description of their own racial
background. More than one race may be reported. For conciseness, the text, tables, and figures in this report use shorter versions of the 1997 Office of Management
and Budget terms for race and Hispanic or Latino origin. For example, the category “not Hispanic, black or African American, single race” is referred to as “non-Hispanic
black” in the text, tables, and figures. Estimates for non-Hispanic persons of races other than white only, black only, and Asian only, or of multiple races, are combined
into the “non-Hispanic, other races and multiple races” category.
2
Persons were defined as uninsured if they did not have any private health insurance, Medicare, Medicaid, Children’s Health Insurance Program (CHIP), state-sponsored
or other government-sponsored health plan, or military plan. Persons were also defined as uninsured if they had only Indian Health Service coverage or had only a
private plan that paid for one type of service, such as accidents or dental care.
3
Public health plan coverage includes Medicaid, CHIP, state-sponsored or other government-sponsored health plan, Medicare, and military plans. A small number of
persons were covered by both public and private plans and were included in both categories.
4
Private health insurance coverage includes any comprehensive private insurance plan (including health maintenance and preferred provider organizations). These
plans include those obtained through an employer, purchased directly, purchased through local or community programs, or purchased through the Health Insurance
Marketplace or a state-based exchange. Private coverage excludes plans that pay for only one type of service, such as accidents or dental care. A small number of
persons were covered by both public and private plans and were included in both categories.
NOTE: Data are based on household interviews of a sample of the civilian noninstitutionalized population.
SOURCE: National Center for Health Statistics, National Health Interview Survey, 2019.
Page | 15 U.S. Department of Health and Human Services ● Centers for Disease Control and Prevention ● National Center for Health Statistics ● Released 9/2020

Health Insurance Coverage: Early Release of Estimates From the National Health Interview Survey, 2019
Table VI. Percentages (and 95% confidence intervals) of persons under age 65 who lacked health insurance coverage, had
public health plan coverage, and had private health insurance coverage at the time of interview, by state Medicaid
expansion status, age group, and 6-month interval: United States, 2019
State Medicaid expansion status
1
, age group (years), Uninsured
2
at the time Public health plan Private health
and 6-month interval of interview coverage
3
insurance coverage
4
Medicaid expansion states
5
Under 65 years
2019 (full year) 9.1 (8.6–9.7) 27.8 (26.7–28.9) 65.0 (63.8–66.2)
Jan–Jun 8.2 (7.5–8.9) 27.4 (25.9–28.9) 66.2 (64.7–67.7)
Jul–Dec 10.0 (9.3–10.8) 28.2 (26.8–29.6) 63.8 (62.2–65.5)
0–17 years
2019 (full year) 3.9 (3.3–4.6) 40.3 (38.3–42.2) 57.6 (55.5–59.7)
Jan–Jun 3.2 (2.6–4.0) 40.2 (37.8–42.5) 58.2 (56.0–60.3)
Jul–Dec 4.6 (3.6–5.7) 40.3 (37.7–43.0) 57.0 (54.0–60.0)
18–64 years
2019 (full year) 11.0 (10.4–11.6) 23.4 (22.3–24.5) 67.6 (66.4–68.8)
Jan–Jun 10.0 (9.1–10.9) 22.8 (21.4–24.4) 69.1 (67.5–70.6)
Jul–Dec 11.9 (11.2–12.8) 23.9 (22.6–25.3) 66.2 (64.6–67.8)
Non-Medicaid expansion states
6
Under 65 years
2019 (full year) 17.1 (15.8–18.5) 23.0 (21.5–24.6) 61.4 (59.0–63.8)
Jan–Jun 16.2 (14.8–17.7) 23.9 (22.2–25.6) 61.6 (59.0–64.2)
Jul–Dec 18.1 (16.4–19.8) 22.2 (20.5–24.0) 61.1 (58.5–63.8)
0–17 years
2019 (full year) 7.0 (6.0–8.1) 43.2 (40.1–46.3) 51.5 (47.9–55.0)
Jan–Jun 6.1 (4.9–7.5) 43.8 (40.0–47.6) 52.0 (48.0–56.1)
Jul–Dec 7.8 (6.5–9.3) 42.5 (39.2–45.9) 50.9 (47.2–54.6)
18–64 years
2019 (full year) 21.2 (19.6–22.8) 15.1 (14.0–16.3) 65.3 (63.2–67.3)
Jan–Jun 20.2 (18.4–22.1) 16.1 (15.0–17.2) 65.4 (63.1–67.6)
Jul–Dec 22.1 (20.0–24.3) 14.2 (12.7–15.7) 65.2 (62.8–67.6)
1
Under provisions of the Affordable Care Act of 2010 (P.L. 111–148, P.L. 111–152), states have the option to expand Medicaid eligibility to cover adults who have
incomes up to and including 138% of the federal poverty level. There is no deadline for states to choose to implement the Medicaid expansion, and they may do so at
any time. As of January 1, 2019, 33 states and the District of Columbia moved forward with Medicaid expansion.
2
Persons were defined as uninsured if they did not have any private health insurance, Medicare, Medicaid, Children’s Health Insurance Program (CHIP), state-sponsored
or other government-sponsored health plan, or military plan. Persons were also defined as uninsured if they had only Indian Health Service coverage or had only a
private plan that paid for one type of service, such as accidents or dental care.
3
Public health plan coverage includes Medicaid, CHIP, state-sponsored or other government-sponsored health plan, Medicare, and military plans. A small number of
persons were covered by both public and private plans and were included in both categories.
4
Private health insurance coverage includes any comprehensive private insurance plan (including health maintenance and preferred provider organizations). These
plans include those obtained through an employer, purchased directly, purchased through local or community programs, or purchased through the Health Insurance
Marketplace or a state-based exchange. Private coverage excludes plans that pay for only one type of service, such as accidents or dental care. A small number of
persons were covered by both public and private plans and were included in both categories.
5
For 2019, states moving forward with Medicaid expansion included: Alaska, Arizona, Arkansas, California, Colorado, Connecticut, Delaware, Hawaii, Illinois, Indiana,
Iowa, Kentucky, Louisiana, Maine, Maryland, Massachusetts, Michigan, Minnesota, Montana, Nevada, New Hampshire, New Jersey, New Mexico, New York, North
Dakota, Ohio, Oregon, Pennsylvania, Rhode Island, Vermont, Virginia, Washington, and West Virginia. The District of Columbia also moved forward with Medicaid
expansion.
6
For 2019, states not moving forward with Medicaid expansion included: Alabama, Florida, Georgia, Idaho, Kansas, Mississippi, Missouri, Nebraska, North Carolina,
Oklahoma, South Carolina, South Dakota, Tennessee, Texas, Utah, Wisconsin, and Wyoming.
NOTE: Data are based on household interviews of a sample of the civilian noninstitutionalized population.
SOURCE: National Center for Health Statistics, National Health Interview Survey, 2019.
Page | 16 U.S. Department of Health and Human Services ● Centers for Disease Control and Prevention ● National Center for Health Statistics ● Released 9/2020

Health Insurance Coverage: Early Release of Estimates From the National Health Interview Survey, 2019
Table VII. Percentage (and 95% confidence interval) and number in millions of persons under age 65 who had exchange-
based private health insurance coverage at the time of interview, by 6-month interval and selected characteristics: United
States, 2019
6-month interval and selected
characteristics Percent (95% confidence interval) Number in millions
2019 (full year)
Age group (years)
Under 65 3.7 (3.4–4.0) 10.0
0–17 1.7 (1.4–2.1) 1.3
18–64 4.4 (4.0–4.8) 8.7
Sex
Male 3.5 (3.1–3.9) 4.7
Female 3.9 (3.5–4.4) 5.3
Poverty status
1
Poor 3.0 (2.2–4.0) 1.1
Near poor 5.3 (4.6–6.1) 2.8
Not poor 3.2 (2.9–3.5) 5.8
Race and ethnicity
2
Hispanic 3.8 (3.1–4.6) 2.1
Non-Hispanic white 3.6 (3.2–4.0) 5.5
Non-Hispanic black 2.9 (2.2–3.9) 1.0
Medicaid expansion status
3
Medicaid expansion states
4
3.3 (3.0–3.8) 5.7
Non-Medicaid expansion states
5
4.3 (3.8–4.9) 4.3
Jan–Jun 2019
Age group (years)
Under 65 3.8 (3.5–4.2) 10.4
0–17 1.8 (1.5–2.3) 1.3
18–64 4.6 (4.1–5.0) 9.0
Sex
Male 3.5 (3.0–4.0) 4.7
Female 4.2 (3.7–4.7) 5.7
Poverty status
1
Poor 3.6 (2.5–5.1) 1.2
Near poor 5.1 (4.2–6.2) 2.7
Not poor 3.2 (2.9–3.6) 5.9
Race and ethnicity
2
Hispanic 3.9 (3.1–4.9) 2.2
Non-Hispanic white 3.7 (3.2–4.2) 5.7
Non-Hispanic black 3.0 (2.2–3.9) 1.0
Medicaid expansion status
3
Medicaid expansion states
4
3.4 (3.0–3.9) 5.8
Non-Medicaid expansion states
5
4.5 (3.7–5.4) 4.5
See footnotes at the end of table.
Page | 17 U.S. Department of Health and Human Services ● Centers for Disease Control and Prevention ● National Center for Health Statistics ● Released 9/2020

Health Insurance Coverage: Early Release of Estimates From the National Health Interview Survey, 2019
Table VII. Percentage (and 95% confidence interval) and number in millions of persons under age 65 who had exchange-
based private health insurance coverage at the time of interview, by 6-month interval and selected characteristics: United
States, 2019—cont.
6-month interval and selected
characteristics Percent (95% confidence interval) Number in millions
Jul–Dec 2019
Age group (years)
Under 65 3.6 (3.1–4.0) 9.7
0–17 1.6 (1.2–2.2) 1.2
18–64 4.3 (3.7–4.8) 8.5
Sex
Male 3.5 (2.9–4.1) 4.7
Female 3.6 (3.1–4.3) 5.0
Poverty status
1
Poor 2.5 (1.6–3.7) 0.9
Near poor 5.5 (4.4–6.7) 2.9
Not poor 3.1 (2.7–3.6) 5.7
Race and ethnicity
2
Hispanic 3.7 (2.8–4.7) 2.0
Non-Hispanic white 3.5 (2.9–4.1) 5.4
Non-Hispanic black 2.9 (1.7–4.7) 1.0
Medicaid expansion status
3
Medicaid expansion states
4
3.3 (2.7–3.9) 5.6
Non-Medicaid expansion states
5
4.1 (3.5–4.7) 4.1
1
Poverty categories are based on the ratio of the family’s income in the previous calendar year to the appropriate poverty threshold (given the family’s size and number
of children), as defined by the U.S. Census Bureau for that year (Semega JL, Kollar MA, Creamer J, Mohanty A. Income and poverty in the United States: 2018. Current
Population Reports, P60–266. 2019). Poor persons were defined as those with incomes less than 100% of the federal poverty level (FPL); near-poor persons have
incomes 100% to less than 200% of the FPL; not-poor persons have incomes that are 200% of the FPL or greater. The percentage of respondents under age 65 with
unknown poverty status in 2019 was 7.6%. Persons with unknown poverty status are not shown in this table. Estimates may differ from estimates that are based on both
reported and imputed income.
2
Hispanic origin and race are two separate and distinct categories. Persons of Hispanic origin may be of any race or combination of races. Hispanic origin includes
persons of Mexican, Puerto Rican, Cuban, Central and South American, or Spanish origin. Race is based on a respondent’s description of their own racial background.
More than one race may be reported. For conciseness, the text, tables, and figures in this report use shorter versions of the 1997 Office of Management and Budget
terms for race and Hispanic or Latino origin. For example, the category “not Hispanic, black or African American, single race” is referred to as “non-Hispanic black” in the
text, tables, and figures.
3
Under provisions of the Affordable Care Act of 2010 (P.L. 111–148, P.L. 111–152), states have the option to expand Medicaid eligibility to cover adults who have income
up to and including 138% of the federal poverty level. There is no deadline for states to choose to implement the Medicaid expansion, and they may do so at any time.
As of January 1, 2019, 33 states and the District of Columbia moved forward with Medicaid expansion.
4
For 2019, states moving forward with Medicaid expansion included: Alaska, Arizona, Arkansas, California, Colorado, Connecticut, Delaware, Hawaii, Illinois, Indiana,
Iowa, Kentucky, Louisiana, Maine, Maryland, Massachusetts, Michigan, Minnesota, Montana, Nevada, New Hampshire, New Jersey, New Mexico, New York, North Dakota,
Ohio, Oregon, Pennsylvania, Rhode Island, Vermont, Virginia, Washington, and West Virginia. The District of Columbia also moved forward with Medicaid expansion.
5
For 2019, states not moving forward with Medicaid expansion included: Alabama, Florida, Georgia, Idaho, Kansas, Mississippi, Missouri, Nebraska, North Carolina,
Oklahoma, South Carolina, South Dakota, Tennessee, Texas, Utah, Wisconsin, and Wyoming.
NOTES: Exchange-based coverage is a private health insurance plan purchased through the Health Insurance Marketplace or state-based exchanges that were
established as part of the Affordable Care Act of 2010 (P.L. 111–148, P.L. 111–152). Data are based on household interviews of a sample of the civilian
noninstitutionalized population.
SOURCE: National Center for Health Statistics, National Health Interview Survey, 2019.
Page | 18 U.S. Department of Health and Human Services ● Centers for Disease Control and Prevention ● National Center for Health Statistics ● Released 9/2020
