
February 2021
ISSUE BRIEF
1
HP-2021-02
TRENDS IN THE U.S. UNINSURED POPULATION,
2010-2020
The number of uninsured nonelderly Americans fell from 48 million in 2010 to 28
million in 2016, before rising to 30 million in the first half of 2020.
Kenneth Finegold, Ann Conmy, Rose C. Chu, Arielle Bosworth, and Benjamin D. Sommers
KEY POINTS
• 30 million U.S. residents lacked health insurance in the first half of 2020, according to newly released
estimates from the National Health Interview Survey (NHIS).
• This number reflects a sharp decline in the number of uninsured Americans since 2010, before
implementation of the large coverage expansions under the Affordable Care Act (ACA). The ACA
produced particularly large coverage gains for Blacks, Latinos, Asian Americans, and Native Americans,
as well for lower-income families.
• However, the uninsured rate has increased since 2016, even prior to the COVID-19 pandemic. From
2017-2019, the uninsured rate rose by 1.7 percentage points, most likely due to new policy changes to
coverage options available under the ACA and Medicaid.
• Estimates from the NHIS show no significant change in uninsured rates during the early months of the
COVID-19 pandemic. However, the pandemic itself created challenges in conducting the survey that
may affect estimates of the uninsured, due to reduced response rates and a temporary shift from an in-
person survey to a telephone survey.
• Compared with other Americans, the uninsured are disproportionately likely to be Black or Latino; be
young adults; have low incomes; or live in states that have not expanded Medicaid.
BACKGROUND
Health insurance is a critical determinant of access to health care. Efforts to expand coverage are central to
improving health equity and responding to the health and economic challenges of the COVID-19 pandemic.
Newly released estimates from the Centers for Disease Control and Prevention (CDC) National Health
Interview Survey (NHIS) provide federal survey data on health coverage for the early period of the COVID-19
pandemic and show that 30 million U.S. residents lacked health insurance in the first half of 2020.
1
In this Issue Brief, we review the new NHIS findings in the context of health coverage trends from 2010
through 2020 and the policy changes occurring during this period. We also examine disparities in coverage
rates by race/ethnicity, income, age, and state Medicaid expansion status. We conclude with an overview of
current efforts to expand health coverage including a new Executive Order on coverage and a Special
Enrollment Period for the ACA Marketplaces beginning February 15, 2021.
February 11, 2021

February 2021
ISSUE BRIEF
2
ESTIMATES OF THE UNINSURED OVER TIME
NHIS provides reliable federal survey data that tracks changes in health coverage, including the number of
uninsured, since 1972.
2
These data suggest the considerable impact of the ACA on coverage since its
enactment in 2010. The number of nonelderly (under 65) uninsured fell from 48.2 million in 2010 to 44.3
million in 2013 as the dependent coverage provisions of the ACA took effect (allowing young adults to stay on
a parent’s plan until age 26), and the economy improved after the Great Recession (Figure 1).
In 2014, the uninsured population began to decrease substantially, when Medicaid expansion was
implemented in selected states and Marketplace coverage became available with Premium Tax Credits and
Cost-Sharing Reductions for those who qualified based on income. The number of nonelderly uninsured fell to
35.7 million in 2014, with additional declines in 2015 and 2016 as more states expanded Medicaid and
Marketplace enrollment grew. By 2016, the number of uninsured individuals had fallen by 20.0 million people
(more than 40 percent) since 2010, with 28.2 million nonelderly uninsured at that time.
However, from 2017 to 2019, the number of uninsured rose each year, despite the strong economic conditions
during this period. By 2019, the last pre-pandemic NHIS estimate was that there were 32.8 million nonelderly
people without health insurance, an increase of 4.6 million (or 14 percent) from 2016.
Data for the first two quarters of 2020, shown in Figure 1, suggest that on average 30.0 million nonelderly
were uninsured over the course of those six months.
3
As noted above, earlier predictions that the loss of
employment in the March/April period would trigger a commensurate rise in the uninsured were not evident
in the newest NHIS estimates. However, the pandemic itself introduced several methodological challenges to
conducting the survey, including a shift from an in-person survey to a telephone survey and a lower response
rate, particularly among younger and lower-income respondents.
4
These changes may have affected the new
coverage estimates, as discussed at more length later in this report.

February 2021
ISSUE BRIEF
3
Figure 1. U.S. Nonelderly Uninsured Population, 2010-2020 (in millions)
Source: Early release of estimates from the National Health Interview Survey, 2010-2020. National Center for Health Statistics. Available
from https://www.cdc.gov/nchs/nhis/healthinsurancecoverage.htm
. 2020 estimates are for January-June only.
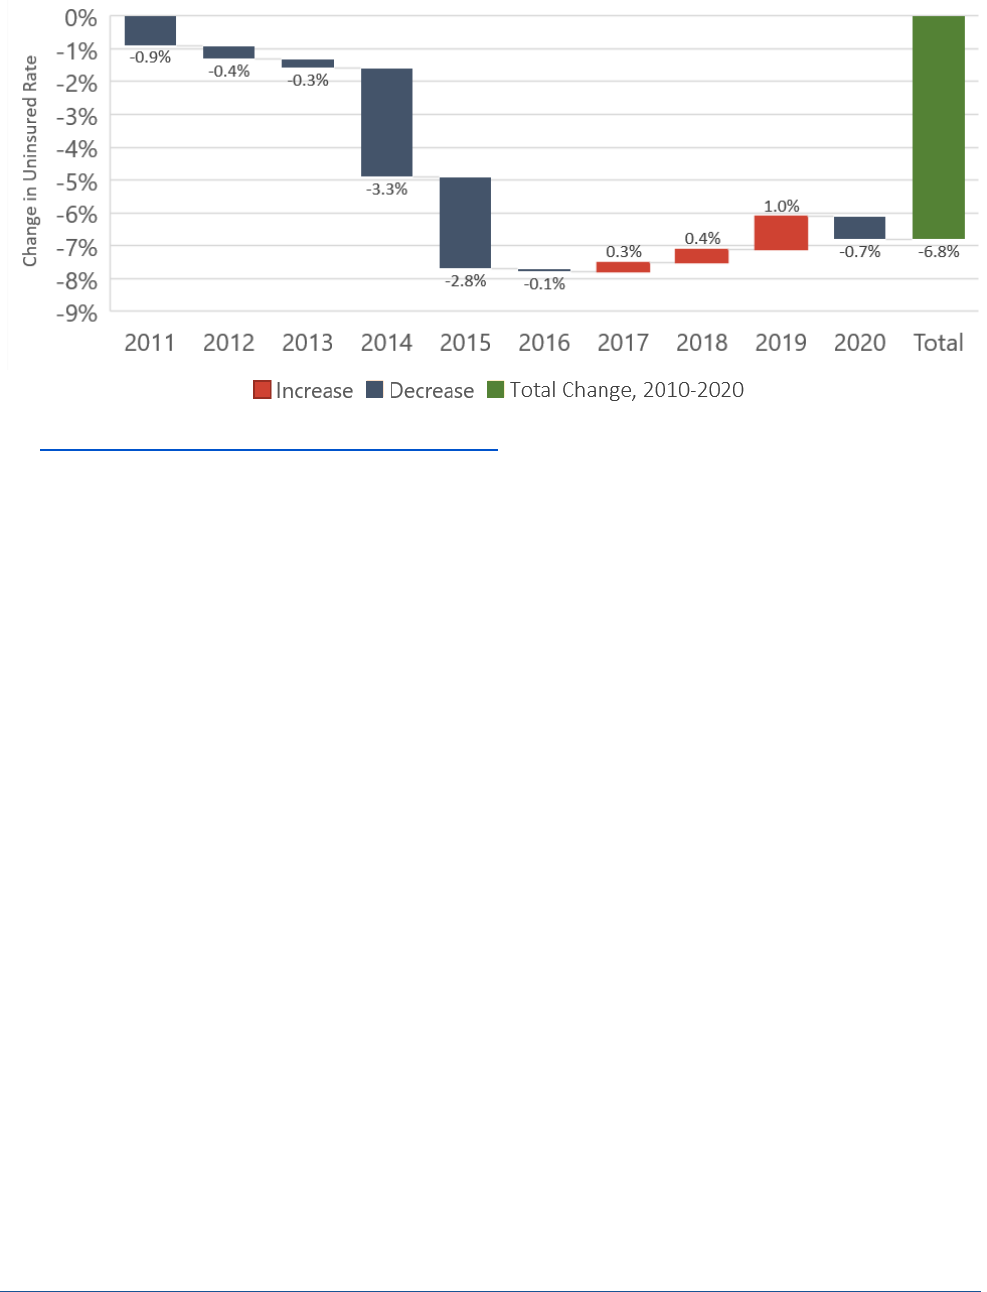
Figure 2 presents annual percentages of the uninsured from 2010-2020. With the implementation of several
major provisions of the Affordable Care Act in 2014, the uninsured rate of nonelderly individuals dropped
precipitously and continued to decrease until 2017. From 2016 to 2019, the rate of uninsured persons
increased by a total of 1.7 percentage points, from 10.4 percent in 2016 to 12.1 percent in 2019. Over the
entire observation period, the uninsured rate decreased by 6.8 percentage points, from 18.2 percent in 2010
to 10.8 percent in the second quarter of 2020. Figure 3 shows the annual declines in the uninsured rate from
2010 to 2016, the increases from 2016 to 2019, and the change from 2019 to the first half of 2020. The last
column sums those year-by-year changes to show the cumulative change from 2010 to 2020.
48.2
45.9
45.2
44.3
35.7
28.4
28.2
28.9
30.1
32.8
30.0
0.0
5.0
10.0
15.0
20.0
25.0
30.0
35.0
40.0
45.0
50.0
2010 2011 2012 2013 2014 2015 2016 2017 2018 2019 2020
Estimated Uninsured (in millions)
Year

February 2021
ISSUE BRIEF
4
Figure 2. Uninsured Share of U.S. Nonelderly, 2010-2020
Source: Early release of estimates from the National Health Interview Survey, 2018-2020. National Center for Health Statistics. Available
from https://www.cdc.gov/nchs/nhis/healthinsurancecoverage.htm
. 2020 estimates are for January-June only.
18.2%
17.3%
16.9%
16.6%
13.3%
10.5%
10.4%
10.7%
11.1%
12.1%
11.1%
0%
5%
10%
15%
20%
2010 2011 2012 2013 2014 2015 2016 2017 2018 2019 2020
Estimated Share Uninsured
Year
February 2021
ISSUE BRIEF
5
Figure 3. Changes in percent of persons under age 65 who were uninsured at the time of interview, 2010–
2020
Source: Early release of estimates from the National Health Interview Survey, 2018-2020. National Center for Health Statistics. Available
from https://www.cdc.gov/nchs/nhis/healthinsurancecoverage.htm
. 2020 estimates are for January-June only.
RACIAL, ETHNIC, AND INCOME-BASED DISPARITIES IN THE UNINSURED RATE
Throughout the past decade, there have been large racial and ethnic disparities in rates of insurance coverage
(Figure 4). While these coverage gaps have narrowed since implementation of the ACA, most minority groups
remained at persistently higher rates of uninsurance in 2019 than Whites. Individuals who identified as
American Indian or Alaskan Native were most likely to be uninsured; in part, this reflects that individuals who
only have coverage through the Indian Health Service are classified by NHIS and other federal surveys as being
uninsured. Individuals who identified as Hispanic or Latino had the second highest rate of uninsured
individuals, with 32 percent in 2010. From 2010 to 2019, the rate of uninsured Hispanic individuals decreased
by nearly one third, but at 22 percent in 2019 it is still almost 2.5 times the rate for White individuals (whose
uninsured percentage dropped from 14 to 9). Asian Americans’ uninsured rate decreased from 17 percent to 7
percent. Native Hawaiians and Other Pacific Islanders also experienced a large decrease in the uninsured rate.

February 2021
ISSUE BRIEF
6
Figure 4. Percent of individuals under age 65 who were uninsured at time of interview, by race, 2010 – 2019
Sources: National Center for Health Statistics, National Health Interview Survey, 2010-2019
5
Notes: In this analysis, individuals were defined as uninsured if they did not have any private health insurance, Medicare, Medicaid,
Children’s Health Insurance Program (CHIP), state-sponsored or other government plan, or military plan. Individuals were also defined
as uninsured if they had only Indian Health Service coverage or had only a private plan that paid for one type of service, such as
accidents or dental care. Data are based on household interviews of a sample of the civilian non-institutionalized population. Native
Hawaiian or Other Pacific Islander and American Indian or Alaska Native populations did not have estimates available for 2019 due to
sample size considerations.
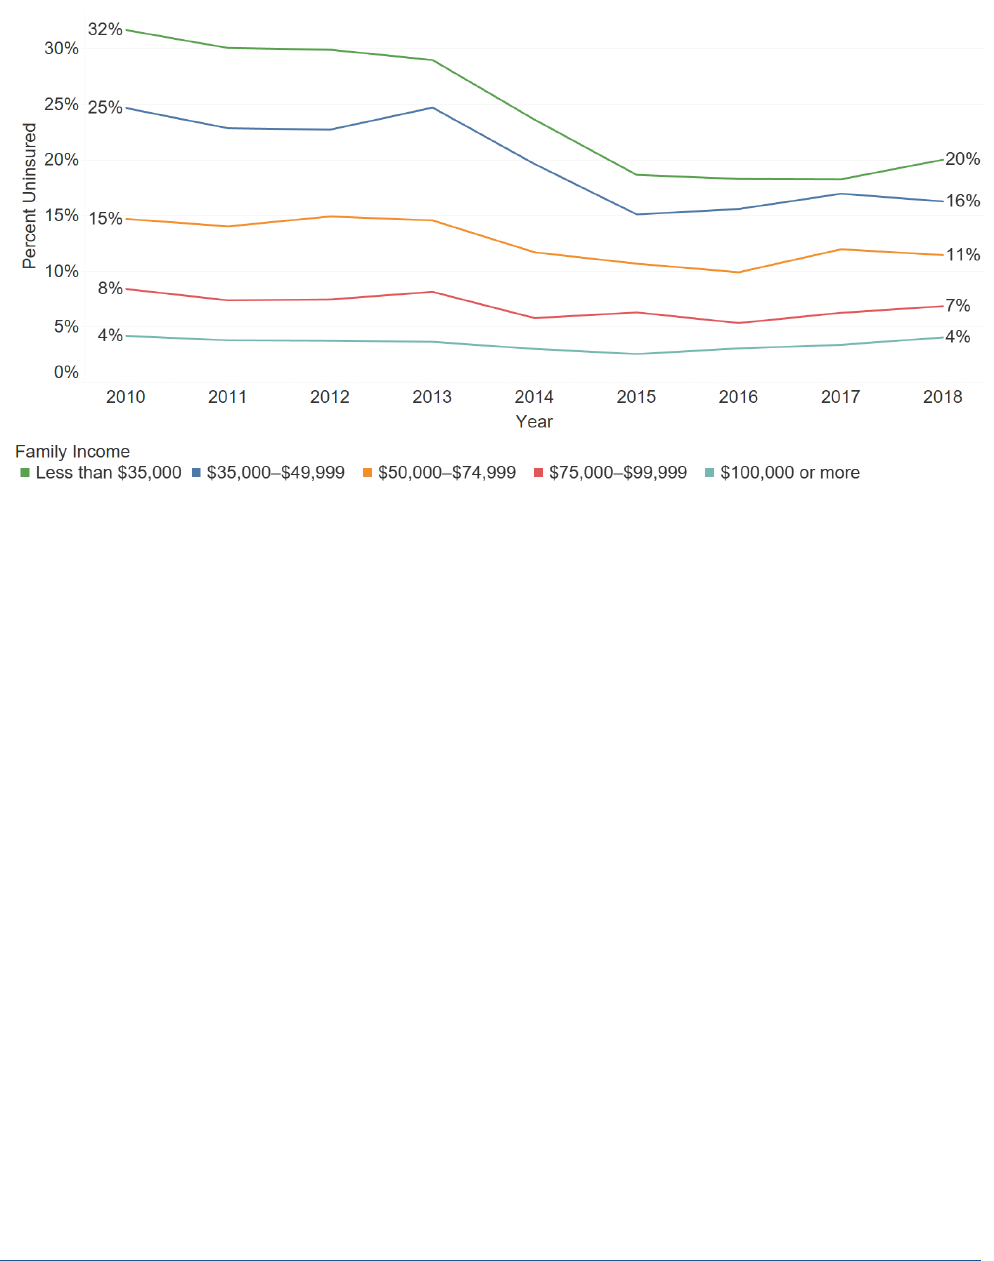
Figure 5 indicates that the decline in the uninsured rate in 2014 and 2015 disproportionately occurred among
lower and lower-middle income populations. In contrast, between 2016 and 2018, the uninsured population
grew modestly in most income groups. The relative gap in insurance coverage by income narrowed over the
2010 to 2018 period but coverage rates continue to vary widely by household income.
February 2021
ISSUE BRIEF
7
Figure 5. Percent of persons under age 65 who were uninsured at the time of interview by family income,
2010 – 2018
Sources: National Center for Health Statistics, National Health Interview Survey, 2010-2018
6
Notes: Estimates are based on household interviews of a sample of the civilian noninstitutionalized population. This table is based on
responses about all persons in the family. Data came from the Person file and were weighted using the Person weight. Unknowns for
the columns were not included in the denominators when calculating percentages.
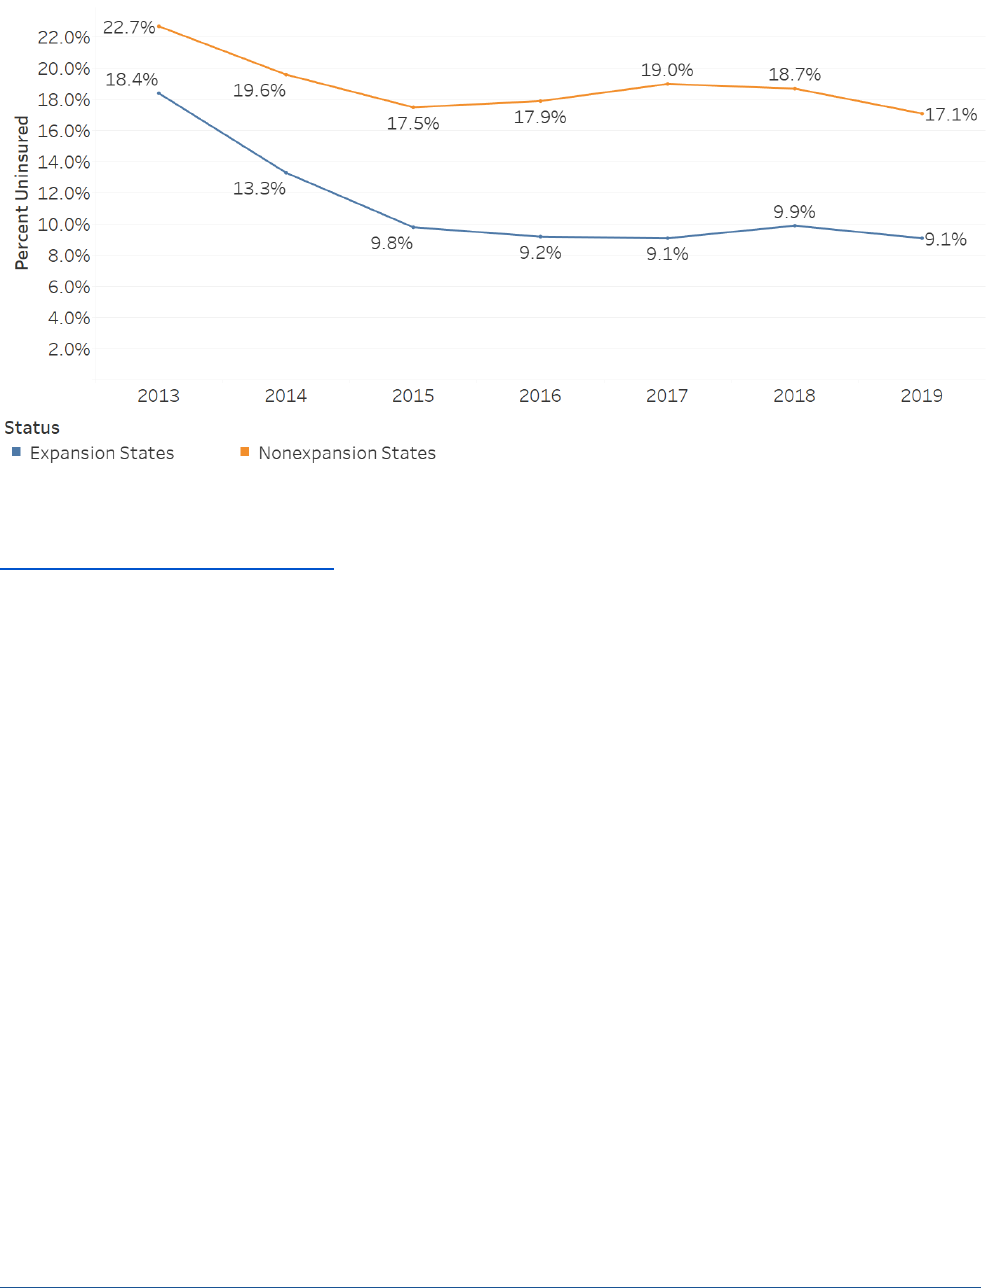
STATE-BASED DIFFERENCES IN INSURANCE COVERAGE
While the country as a whole experienced a significant reduction in the rate of uninsured individuals in 2014
and 2015, the changes were largest in the states that have expanded Medicaid under the ACA.
7
The uninsured
rate among adults 18-64 in expansion states was cut in half from 18.4 percent in 2013 to 9.2 percent in 2016,
and was 9.1 percent in 2019. In non-expansion states, there were modest reductions in the uninsured rate
from 2013 to 2016 (from 22.7 percent to 17.9 percent), but the uninsured rate has remained nearly twice as
high as that in expansion states in 2019 (17.1 percent vs. 9.1 percent) (Figure 6).
February 2021
ISSUE BRIEF
8
Figure 6. Percentage of adults aged 18–64 who were uninsured at the time of interview, by year and state
Medicaid expansion status: United States, 2013–2019
Sources: 2010-2019: Cohen RA, Terlizzi EP, Martinez ME. Health insurance coverage: Early release of estimates from the National
Health Interview Survey, 2018. National Center for Health Statistics. May 2019. Available from:
https://www.cdc.gov/nchs/nhis/releases.htm.
Notes: For 2013 and 2014, there were 26 Medicaid expansion states including District of Columbia. For 2015, there were 29 Medicaid
expansion states. For 2016–2018, there were 32 Medicaid expansion states.
The impact of states electing to expand Medicaid is also evident in Table 1, which shows coverage totals by
state based on data from the Census Bureau’s 2019 American Community Survey Public Use Microdata Sample
(ACS PUMS), currently the most recent year of data available for state-by-state estimates. Texas and Florida,
with the second and third largest populations of any state and no Medicaid expansion, account for 5.4 million
and 2.9 million of the nonelderly uninsured. The two other largest non-expansion states, Georgia and North
Carolina, each have more than one million uninsured individuals. As of 2019, more than one in three of the
nation’s nonelderly uninsured population resided in these four states.
February 2021
ISSUE BRIEF
9
Table 1. Type of Health Coverage Among the Nonelderly Population, Number of People, by State (2019)
Type of Coverage
State
Medicare
Military
Medicaid
Employer
Nongroup
Uninsured
Total
Alabama
194,481
188,291
732,350
2,172,176
271,491
490,226
4,049,015
Alaska*
12,451
90,551
124,742
303,118
25,065
82,446
638,373
Arizona*
170,365
211,839
1,269,166
3,107,576
373,416
840,445
5,972,807
Arkansas*
121,519
80,464
652,397
1,193,370
160,606
287,170
2,495,526
California*
708,146
775,004
8,455,982
18,056,451
2,602,647
3,078,622
33,676,852
Colorado*
94,291
252,150
809,532
2,901,095
394,271
460,110
4,911,449
Connecticut*
73,415
53,587
633,833
1,793,412
174,762
205,946
2,934,955
Delaware*
24,454
36,747
162,838
450,343
41,616
68,673
784,671
District of Columbia*
16,003
19,445
140,967
362,656
53,957
25,027
618,055
Florida
556,080
674,497
2,770,980
8,140,138
1,977,990
2,860,759
16,980,444
Georgia
279,746
423,510
1,433,637
4,905,289
581,876
1,469,494
9,093,552
Hawaii*
23,976
138,018
197,569
672,624
56,734
58,073
1,146,994
Idaho
42,592
51,933
226,957
834,320
157,256
185,556
1,498,614
Illinois*
269,594
184,333
2,003,514
6,593,396
651,758
924,271
10,626,866
Indiana*
186,345
125,886
1,004,163
3,429,889
304,588
598,268
5,649,139
Iowa*
67,556
59,621
515,991
1,650,908
155,522
151,806
2,601,404
Kansas
68,958
112,647
327,492
1,490,005
163,349
272,630
2,435,081
Kentucky*
187,066
120,832
943,956
1,987,177
175,466
297,357
3,711,854
Louisiana*
158,609
125,306
1,147,881
1,817,069
222,450
436,211
3,907,526
Maine*
53,040
38,972
191,379
588,312
77,681
108,374
1,057,758
Maryland*
142,998
226,763
950,586
3,083,026
323,828
356,975
5,084,176
Massachusetts*
148,275
67,879
1,213,697
3,688,838
393,644
208,673
5,721,006
Michigan*
313,114
128,934
1,781,040
4,882,244
527,149
589,382
8,221,863
Minnesota*
94,523
79,208
835,183
3,146,106
289,735
274,202
4,718,957
Mississippi
114,424
94,535
552,600
1,180,083
142,491
404,288
2,488,421
Missouri
190,969
165,212
710,237
3,022,263
354,516
634,023
5,077,220
Montana*
26,292
38,967
189,262
432,076
84,616
88,745
859,958
Nebraska
35,259
58,858
190,771
1,047,729
130,353
157,526
1,620,496
Nevada*
59,327
102,882
460,604
1,437,122
164,981
357,790
2,582,706
New Hampshire*
33,821
27,192
151,617
731,203
76,555
87,559
1,107,947
New Jersey*
183,434
92,113
1,228,466
4,718,618
482,308
700,005
7,404,944
New Mexico*
63,819
77,584
575,250
710,237
82,586
209,125
1,718,601
New York*
452,244
196,180
4,093,603
9,249,030
1,146,726
1,019,979
16,157,762
North Carolina
290,485
481,858
1,507,633
4,571,836
697,123
1,188,786
8,737,721
North Dakota*
12,672
35,728
74,104
398,003
66,529
54,817
641,853
Ohio*
301,496
195,363
2,006,996
5,883,001
465,425
793,092
9,645,373
Oklahoma
130,799
159,900
551,188
1,669,199
216,232
599,504
3,326,822
Oregon*
95,825
87,388
737,077
1,989,203
237,389
303,249
3,450,131
Pennsylvania*
360,370
198,827
2,104,571
6,313,695
668,272
765,682
10,411,417
Rhode Island*
33,583
19,950
167,890
535,625
71,309
43,576
871,933
South Carolina
155,448
230,018
771,277
2,185,983
306,718
562,070
4,211,514
South Dakota
20,863
29,573
91,143
430,172
72,879
85,410
730,040
Tennessee
195,567
224,531
1,086,653
3,085,238
384,698
716,011
5,692,698
Texas
575,264
860,495
3,767,819
13,044,068
1,607,854
5,400,579
25,256,079
Utah
40,983
67,209
245,430
1,880,024
295,986
311,514
2,841,146
Vermont*
18,936
12,761
119,203
288,042
33,128
26,786
498,856
Virginia*
194,348
704,649
948,558
4,204,695
439,622
684,085
7,175,957
Washington*
149,908
318,210
1,282,374
3,786,689
374,748
494,757
6,406,686
West Virginia*
80,228
46,349
386,923
739,895
47,440
125,043
1,425,878
Wisconsin
125,344
96,061
751,635
3,181,181
306,026
344,232
4,804,479
Wyoming
12,626
19,123
53,349
282,011
40,750
71,306
479,165
Total
7,961,931
8,907,933
53,332,065
154,246,459
19,154,117
30,560,235
274,162,740
February 2021
ISSUE BRIEF
10
Notes: * Medicaid expansion state in 2019. Among states shown as non-expansion in 2019, Idaho, Nebraska, and Utah expanded in
2020; Missouri and Oklahoma votes approved Medicaid expansion and implementation is planned in both states for July 2021.
Individuals reporting more than one type of coverage are assigned using hierarchy of Medicare, Military (Tricare and VA),
Medicaid/CHIP, Employer-Sponsored Insurance, and Nongroup (Marketplace and off-Marketplace). Individuals reporting no coverage
or coverage from Indian Health Service only are assigned as Uninsured.
Source: ASPE analysis of 2019 American Community Survey Public Use Microdata Sample (ACS PUMS).
Table 2 shows each state’s distribution of health insurance coverage by type of coverage. Texas, at 21.4
percent, has the highest percentage of nonelderly who are uninsured, and the next five states with the highest
share of uninsured (Oklahoma, Florida, Mississippi, Georgia, and Wyoming) are also non-expansion states. The
share of the under-65 population with Medicare is small, about 3 percent, because it is only available to those
with disabilities or End-Stage Renal Disease. Military coverage for families of active service members and
veterans is high in Alaska, Hawaii, and Virginia due to the locations of defense facilities. The highest Medicaid
share is in New Mexico, which expanded Medicaid.
Table 2. Type of Health Coverage Among the Nonelderly Population, By State (2019)
Type of Coverage
State
Medicare
Military
Medicaid
Employer
Nongroup
Uninsured
Total
Alabama
4.8%
4.7%
18.1%
53.6%
6.7%
12.1%
100.0%
Alaska*
2.0%
14.2%
19.5%
47.5%
3.9%
12.9%
100.0%
Arizona*
2.9%
3.5%
21.2%
52.0%
6.3%
14.1%
100.0%
Arkansas*
4.9%
3.2%
26.1%
47.8%
6.4%
11.5%
100.0%
California*
2.1%
2.3%
25.1%
53.6%
7.7%
9.1%
100.0%
Colorado*
1.9%
5.1%
16.5%
59.1%
8.0%
9.4%
100.0%
Connecticut*
2.5%
1.8%
21.6%
61.1%
6.0%
7.0%
100.0%
Delaware*
3.1%
4.7%
20.8%
57.4%
5.3%
8.8%
100.0%
District of Columbia*
2.6%
3.1%
22.8%
58.7%
8.7%
4.0%
100.0%
Florida
3.3%
4.0%
16.3%
47.9%
11.6%
16.8%
100.0%
Georgia
3.1%
4.7%
15.8%
53.9%
6.4%
16.2%
100.0%
Hawaii*
2.1%
12.0%
17.2%
58.6%
4.9%
5.1%
100.0%
Idaho
2.8%
3.5%
15.1%
55.7%
10.5%
12.4%
100.0%
Illinois*
2.5%
1.7%
18.9%
62.0%
6.1%
8.7%
100.0%
Indiana*
3.3%
2.2%
17.8%
60.7%
5.4%
10.6%
100.0%
Iowa*
2.6%
2.3%
19.8%
63.5%
6.0%
5.8%
100.0%
Kansas
2.8%
4.6%
13.4%
61.2%
6.7%
11.2%
100.0%
Kentucky*
5.0%
3.3%
25.4%
53.5%
4.7%
8.0%
100.0%
Louisiana*
4.1%
3.2%
29.4%
46.5%
5.7%
11.2%
100.0%
Maine*
5.0%
3.7%
18.1%
55.6%
7.3%
10.2%
100.0%
Maryland*
2.8%
4.5%
18.7%
60.6%
6.4%
7.0%
100.0%
Massachusetts*
2.6%
1.2%
21.2%
64.5%
6.9%
3.6%
100.0%
Michigan*
3.8%
1.6%
21.7%
59.4%
6.4%
7.2%
100.0%
Minnesota*
2.0%
1.7%
17.7%
66.7%
6.1%
5.8%
100.0%
Mississippi
4.6%
3.8%
22.2%
47.4%
5.7%
16.2%
100.0%
Missouri
3.8%
3.3%
14.0%
59.5%
7.0%
12.5%
100.0%
Montana*
3.1%
4.5%
22.0%
50.2%
9.8%
10.3%
100.0%
Nebraska
2.2%
3.6%
11.8%
64.7%
8.0%
9.7%
100.0%
Nevada*
2.3%
4.0%
17.8%
55.6%
6.4%
13.9%
100.0%
New Hampshire*
3.1%
2.5%
13.7%
66.0%
6.9%
7.9%
100.0%
New Jersey*
2.5%
1.2%
16.6%
63.7%
6.5%
9.5%
100.0%
New Mexico*
3.7%
4.5%
33.5%
41.3%
4.8%
12.2%
100.0%
New York*
2.8%
1.2%
25.3%
57.2%
7.1%
6.3%
100.0%
North Carolina
3.3%
5.5%
17.3%
52.3%
8.0%
13.6%
100.0%
North Dakota*
2.0%
5.6%
11.5%
62.0%
10.4%
8.5%
100.0%
Ohio*
3.1%
2.0%
20.8%
61.0%
4.8%
8.2%
100.0%
Oklahoma
3.9%
4.8%
16.6%
50.2%
6.5%
18.0%
100.0%
Oregon*
2.8%
2.5%
21.4%
57.7%
6.9%
8.8%
100.0%

February 2021
ISSUE BRIEF
11
Type of Coverage
State
Medicare
Military
Medicaid
Employer
Nongroup
Uninsured
Total
Pennsylvania*
3.5%
1.9%
20.2%
60.6%
6.4%
7.4%
100.0%
Rhode Island*
3.9%
2.3%
19.3%
61.4%
8.2%
5.0%
100.0%
South Carolina
3.7%
5.5%
18.3%
51.9%
7.3%
13.3%
100.0%
South Dakota
2.9%
4.1%
12.5%
58.9%
10.0%
11.7%
100.0%
Tennessee
3.4%
3.9%
19.1%
54.2%
6.8%
12.6%
100.0%
Texas
2.3%
3.4%
14.9%
51.6%
6.4%
21.4%
100.0%
Utah
1.4%
2.4%
8.6%
66.2%
10.4%
11.0%
100.0%
Vermont*
3.8%
2.6%
23.9%
57.7%
6.6%
5.4%
100.0%
Virginia*
2.7%
9.8%
13.2%
58.6%
6.1%
9.5%
100.0%
Washington*
2.3%
5.0%
20.0%
59.1%
5.8%
7.7%
100.0%
West Virginia*
5.6%
3.3%
27.1%
51.9%
3.3%
8.8%
100.0%
Wisconsin
2.6%
2.0%
15.6%
66.2%
6.4%
7.2%
100.0%
Wyoming
2.6%
4.0%
11.1%
58.9%
8.5%
14.9%
100.0%
Total
2.9%
3.2%
19.5%
56.3%
7.0%
11.1%
100.0%
Notes: * Medicaid expansion state in 2019. Among states shown as non-expansion in 2019, Idaho, Nebraska, and Utah expanded in
2020; Missouri and Oklahoma votes approved Medicaid expansion and implementation is planned in both states for July 2021.
Individuals reporting more than one type of coverage are assigned using hierarchy of Medicare, Military (Tricare and VA),
Medicaid/CHIP, Employer-Sponsored Insurance, and Nongroup (Marketplace and off-Marketplace). Individuals reporting no coverage
or coverage from Indian Health Service only are assigned as Uninsured.
Source: ASPE analysis of 2019 American Community Survey Public Use Microdata Sample (ACS PUMS).
More than half the nonelderly have employer coverage nationally, as well in most states, with lower rates in
Alaska, Arkansas, Florida, Louisiana, Mississippi, and New Mexico. The low rate of employer coverage in Florida
contributes to its high rate of nongroup coverage and – combined with the lack of Medicaid expansion – its
high percentage of uninsured.
8
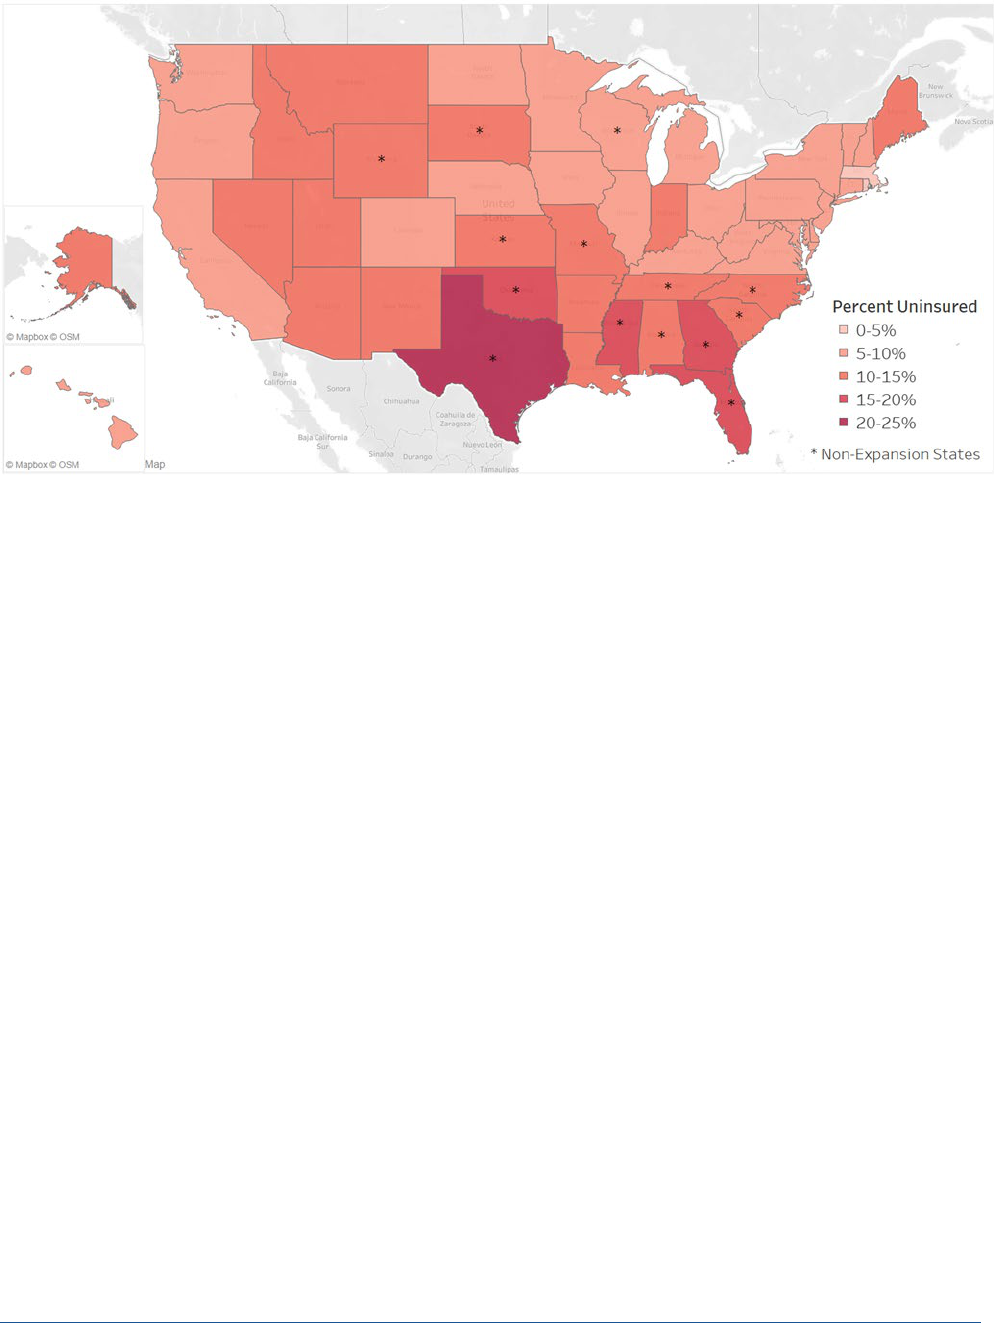
Figure 7 shows the percent of persons under age 65 who were uninsured in 2019 by state. As discussed
previously, states that have not expanded Medicaid coverage had significantly higher uninsured rates.
Oklahoma and Texas had the highest uninsured rate.
February 2021
ISSUE BRIEF
12
Figure 7. Nonelderly Health Insurance Coverage by State, 2019
Source: ASPE analysis of 2019 American Community Survey Public Use Microdata Sample (ACS PUMS).
DISCUSSION
The Affordable Care Act’s Effects on the Uninsured Rate
The ACA’s coverage provisions resulted in 20 million adults gaining health insurance coverage from 2010
through early 2016. These large health insurance gains occurred broadly across population groups.
9
For
instance, ASPE has previously estimated that:
• About 3 million Black nonelderly adults gained coverage.
• About 4 million Hispanic nonelderly adults gained.
• About 8.9 million White non-Hispanic nonelderly adults gained coverage.
Groups that had high uninsured rates prior to 2014—including low income adults and minority populations—
had the largest coverage gains through 2016, especially in states that expanded Medicaid.
10
Almost all the
decline in the uninsured rate occurred among nonelderly adults.
Post-2016 Increases in the Uninsured Rate
Starting in 2017, the earlier reductions in the uninsured population were followed by small increases each
year. The increase in the uninsured rate during this period can potentially be explained by several factors.
Overall, 1.9 million fewer individuals were enrolled in Medicaid and CHIP in July 2019, compared to December
2017.
11
The number of children declined by about 1.1 million and the number of adults declined by about
750,000. About 70 percent of states (36 states) experienced decreases in Medicaid and CHIP enrollment
between December 2017 and July 2019. Some of this change was associated with improvement in the
economy (with some switching from Medicaid to employer coverage, or from Medicaid to CHIP; in fact, CHIP
enrollment rose during this period, but by less than the decline in Medicaid enrollment). But another factor

February 2021
ISSUE BRIEF
13
contributing to the increase in the uninsured population was state Medicaid policies and processes that made
it more difficult to enroll, renew, and maintain coverage.
12
Other potential factors causing the increase in the uninsured population from 2017 to 2019 include reduced
funding for outreach and enrollment in the ACA Marketplaces, and changes in policies and proposals regarding
immigration, deportation, and enforcement of the public charge rule that have made some families reluctant
to enroll in subsidized health insurance.
13
COVID-19 Effects on the Uninsured
During the early months of the COVID-19 pandemic and the resulting economic recession, many research
groups released a wide range of initial estimates of the potential shifts in health insurance in response to the
COVID-19 pandemic.
14
Medicaid enrollment and spending typically increase during economic downturns.
About 56 percent of the population has health insurance from an employer, and the increase in
unemployment during the pandemic may indicate loss of health insurance coverage as well.
The NHIS 2020 health insurance release is the first comprehensive report of health insurance coverage during
the first domestic peak of COVID-19 cases (the second quarter of 2020). However, other groups have released
survey results estimating how coverage changed during 2020.
15
The 2020 Commonwealth Fund’s Biennial
Health Insurance Survey was conducted during the first and second quarters of the year and found 12.5
percent of adults were uninsured.
16
Compared to results of the 2018 Commonwealth Fund survey, there were
no statistically significant changes in reported health insurance coverage in the first half of 2020.
In response to the COVID-19 pandemic and corresponding economic recession, the U.S. Census Bureau
developed a new experimental household survey to collect information of how people’s lives have changed
since the pandemic, including health insurance coverage. The COVID-19 Census Household PULSE Survey data
on health insurance showed a 22% relative decrease in the number of participants reporting being uninsured
at the time of interview from April 23 to May 5, 2020, to January 6 to 18, 2021, suggesting the number of
uninsured from the recent NHIS release may decline in the coming quarters.
17
However, the small sample sizes
of those weekly estimates may limit their usefulness, and the NHIS data represent a more robust and validated
data source.
A driving factor for fear of increases in the uninsured was the high unemployment rate during the beginning
months of the COVID-19 pandemic. Since spring 2020, the unemployment rate has improved, while remaining
above the pre-pandemic baseline.
18
The Congressional Budget Office estimates the number of uninsured
individuals increased from 30.5 million in 2019 to 31 or 32 million by the end of 2020.
19
Since the release of initial projections of changes in health insurance due to the COVID-19 pandemic, available
data including the new NHIS estimates suggest that the shift in coverage during 2020 was smaller than
originally expected. Potential factors that may explain the smaller increase in the uninsured rate include:
• Pre-pandemic research suggests that the ACA plays a critical role in helping people maintain coverage after
job losses, which may have mitigated coverage changes due to unemployment;
20
• Many of those individuals who lost some form of employment had low incomes or were in jobs without
health benefits, and either enrolled in Medicaid or were already uninsured before their job losses;
21
• Economic stimuli from the Families First Coronavirus Response Act (FFCRA) and CARES Acts leading to
partial economic recovery;
• Employers opting to temporarily layoff or furlough their employees and continue their benefits rather than
implement permanent layoffs with loss of benefits;
22

February 2021
ISSUE BRIEF
14
• Individuals who lost employer coverage may have been able to enroll in coverage through a Federally-
Facilitated (FFM) special enrollment period (SEP) or State-based Marketplace (SBM) SEPs, and all but one
SBM had COVID-19 SEPs starting in March 2020 for the uninsured;
23
• Those enrolled in Medicaid during the COVID-19 public health emergency (PHE) cannot be disenrolled
even if their eligibility changes, as part of the maintenance-of-effort requirements states must meet to
receive increased Medicaid funding under section 6008 of the FFCRA. As a result of this policy, as well as
the pandemic effects, combined Medicaid and CHIP enrollment grew by 9.5 percent between February and
September 2020 (from 70.6 million to 77.3 million).
24
COVID-19 Effects on Surveys
The COVID-19 pandemic makes in-person data collection more challenging.
25
Beginning in March 2020, the
NHIS temporarily converted to a telephone-only survey, resulting in a varied response rate.
26
Between the first
and second quarter of 2020, the response rate dropped from 60.0 percent to 42.7 percent. While the
telephone-first strategy continued throughout 2020, in July some in-person data collection resumed in certain
areas and fully resumed in September. Even so, the NHIS response rate remained below pre-pandemic
baseline, at approximately 54 percent in the fourth quarter of 2020. In turn, the sample composition
overrepresented older adults, those with higher incomes, and those with more education, all groups that have
higher coverage rates than the general population. Populations at greater risk for being uninsured may have
been more difficult to contact during the pandemic, which may have led to an underestimate of the uninsured
rate during this period. In addition, no single survey source on the uninsured rate is definitive, and estimates
from different sources typically vary to some extent.
27
The challenges associated with survey data collection
during the COVID-19 pandemic are likely to affect other surveys in addition to the NHIS, adding uncertainty
and potentially even greater variation in coverage estimates across surveys in 2020.
28
POLICY APPROACHES FOR INCREASING COVERAGE
The President signed an Executive Order on Strengthening Medicaid and the Affordable Care Act on January
28, 2021.
29
HHS is implementing a Special Enrollment Period (SEP) according to the Executive Order. The SEP
for Federally facilitated Marketplaces will be available from February 15 to May 15, 2021, for new enrollees
and current enrollees with no requirements for SEP applicants to have previously had coverage. At least
fourteen of the fifteen State-based Marketplaces (SBMs) have followed the FFM and are implementing SEPs
with the same or similar time period.
30
All but one of the 13 SBMs operating in 2020 also had 2020 COVID SEPs allowing those without insurance
coverage to enroll after the 2020 Open Enrollment Period (OEP). Comparing mid-year enrollments in 2020 vs.
2019 (which include both standard SEP and COVID-related SEP enrollment), six SBMs had a larger percentage
increase than the 30 percent increase in the FFM,
showing the possibility of the new pandemic SEPs to boost
health coverage.
31
An Urban Institute survey of uninsured adults in September 2020 showed that 46 percent knew only a little or
nothing at all about the ACA Marketplaces and 65 percent knew only a little or nothing about the Marketplace
subsidies.
32
Many people need assistance to enroll in coverage. Despite the availability of Marketplace Call
Centers in each state and a listing of in-person assistance on HealthCare.gov, half of consumers looking for
coverage during the 2020 open enrollment had difficulties enrolling and almost 5 million consumers couldn’t
get in-person help.
33
The most common reason given in a 2019 NHIS survey for being uninsured was that the
coverage was not affordable, with 73.7 percent answering with that reason.
34
About a quarter (25.3 percent)
did not think they were eligible for coverage, 21.3 percent said they did not need or want health insurance,
and 18.4 percent thought signing up was too difficult or confusing.

February 2021
ISSUE BRIEF
15
Given these findings, policies around marketing, outreach, and enrollment assistance can play an important
role in expanding coverage. Covered California marketing and outreach in 2016 and 2017 was estimated to
have lowered premiums by 6-8 percent with more than 3:1 return on investment by enrolling a healthier risk
pool.
35
More funding for FFM marketing, outreach, and assisters could help educate uninsured adults and
increase coverage. Funding for FFM navigators and enrollment assisters was about $20 million in FY 2019 and
FY 2020, roughly one-fifth of what it was in FY 2013 ($107 million) and FY 2014 ($100 million).
36
Similarly,
funding for consumer education and outreach shrank from $77 million in FY 2013 and $101 million in 2014 to
$11 million in each of the years FY 2018-FY 2020.
37
Overall, the number of nonelderly uninsured is higher now than it was in 2016, and the COVID-19 pandemic
has created new threats to coverage. New policy approaches may help reduce the number of uninsured
people in the U.S., particularly for communities at the highest risk for lacking insurance – racial and ethnic
minorities, young adults, and populations with low incomes.

February 2021
ISSUE BRIEF
16
NOTES
1
Cohen RA and Terlizzi EP. Health insurance coverage: Early release of quarterly estimates from the National Health
Interview Survey, April 2019–June 2020. National Center for Health Statistics. February 2021. Available from:
https://www.cdc.gov/nchs/nhis/releases.htm
.
2
Cohen RA, Makuc DM, Bernstein AB, Bilheimer LT, Powell-Griner E. Health insurance coverage trends, 1959–2007:
Estimates from the National Health Interview Survey. National health statistics reports; no. 17. Hyattsville, MD: National
Center for Health Statistics. 2009. https://www.cdc.gov/nchs/data/nhsr/nhsr017.pdf
.
3
Cohen RA, Terlizzi EP, Cha AE, Martinez ME. Health insurance coverage: Early release of estimates from the National
Health Interview Survey, January–June 2020. National Center for Health Statistics. February 2021. DOI:
https://dx.doi.org/10.15620/cdc:100469.
4
Dahlhamer JM, Bramlett MD, Maitland A, Blumberg SJ. Preliminary evaluation of nonresponse bias due to the COVID-19
pandemic on National Health Interview Survey estimates, April-June 2020. Hyattsville, MD: National Center for Health
Statistics. February 2021. Available from: https://www.cdc.gov/nchs/data/nhis/earlyrelease/nonresponse202102-508.
5
2010: Adams PF, Martinez ME, Vickerie JL, Kirzinger WK. Summary health statistics for the U.S. population: National
Health Interview Survey, 2010. National Center for Health Statistics. Vital Health Stat 10(251). 2011.
2011: Adams PF, Kirzinger WK, Martinez ME. Summary health statistics for the U.S. population: National Health Interview
Survey, 2011. National Center for Health Statistics. Vital Health Stat 10(255). 2012.
2012: Adams PF, Kirzinger WK, Martinez ME. Summary health statistics for the U.S. population: National Health Interview
Survey, 2012. National Center for Health Statistics. Vital Health Stat 10(259). 2013.
2013: Adams PF, Martinez ME, Benson V. Tables of Summary Health Statistics for the U.S. Population: 2013 National
Health Interview Survey. 2015. Available from: http://www.cdc.gov/nchs/nhis/SHS/tables.htm.
2014: Adams PF, Benson V. Tables of Summary Health Statistics for the U.S. Population: 2014 National Health Interview
Survey. 2015. Available from: http://www.cdc.gov/nchs/nhis/SHS/tables.htm.
2015: Lucas JW, Benson V. Tables of Summary Health Statistics for the U.S. Population: 2015 National Health Interview
Survey. National Center for Health Statistics. 2017. Available from: http://www.cdc.gov/nchs/nhis/SHS/tables.htm.
2016: Lucas JW, Benson V. Tables of Summary Health Statistics for the U.S. Population: 2016 National Health Interview
Survey. National Center for Health Statistics. 2018. Available from: https://www.cdc.gov/nchs/nhis/SHS/tables.htm.
2017: Lucas JW, Benson V. Tables of Summary Health Statistics for the U.S. Population: 2017 National Health Interview
Survey. National Center for Health Statistics. 2019. Available from: https://www.cdc.gov/nchs/nhis/SHS/tables.htm.
2018: Lucas JW, Benson V. Tables of Summary Health Statistics for the U.S. Population: 2018 National Health Interview
Survey. National Center for Health Statistics. 2019. Available from: https://www.cdc.gov/nchs/nhis/SHS/tables.htm.
2019: Cohen RA, Cha AE, Martinez ME, Terlizzi EP. Health insurance coverage: Early release of estimates from the National
Health Interview Survey, 2019. National Center for Health Statistics. September 2020. Available from:
https://www.cdc.gov/nchs/nhis/healthinsurancecoverage.htm.
6
2010: Adams PF, Martinez ME, Vickerie JL, Kirzinger WK. Summary health statistics for the U.S. population: National
Health Interview Survey, 2010. National Center for Health Statistics. Vital Health Stat 10(251). 2011.
2011: Adams PF, Kirzinger WK, Martinez ME. Summary health statistics for the U.S. population: National Health Interview
Survey, 2011. National Center for Health Statistics. Vital Health Stat 10(255). 2012.
2012: Adams PF, Kirzinger WK, Martinez ME. Summary health statistics for the U.S. population: National Health Interview
Survey, 2012. National Center for Health Statistics. Vital Health Stat 10(259). 2013.
2013: Adams PF, Martinez ME, Benson V. Tables of Summary Health Statistics for the U.S. Population: 2013 National
Health Interview Survey. 2015. Available from: http://www.cdc.gov/nchs/nhis/SHS/tables.htm.
2014: Adams PF, Benson V. Tables of Summary Health Statistics for the U.S. Population: 2014 National Health Interview
Survey. 2015. Available from: http://www.cdc.gov/nchs/nhis/SHS/tables.htm.
2015: Lucas JW, Benson V. Tables of Summary Health Statistics for the U.S. Population: 2015 National Health Interview
Survey. National Center for Health Statistics. 2017. Available from: http://www.cdc.gov/nchs/nhis/SHS/tables.htm.
2016: Lucas JW, Benson V. Tables of Summary Health Statistics for the U.S. Population: 2016 National Health Interview
Survey. National Center for Health Statistics. 2018. Available from: https://www.cdc.gov/nchs/nhis/SHS/tables.htm.
2017: Lucas JW, Benson V. Tables of Summary Health Statistics for the U.S. Population: 2017 National Health Interview
Survey. National Center for Health Statistics. 2019. Available from: https://www.cdc.gov/nchs/nhis/SHS/tables.htm.
2018: Lucas JW, Benson V. Tables of Summary Health Statistics for the U.S. Population: 2018 National Health Interview
Survey. National Center for Health Statistics. 2019. Available from: https://www.cdc.gov/nchs/nhis/SHS/tables.htm.

February 2021
ISSUE BRIEF
17
7
This count includes the District of Columbia as a state and excludes Missouri and Oklahoma, which have approved but
not yet implemented Medicaid expansion under the ACA. The other non-expansion states are Alabama, Florida, Georgia,
Kansas, Mississippi, North Carolina, South Carolina, South Dakota, Tennessee, Texas, Wisconsin, and Wyoming. See Kaiser
Family Foundation, State Health Facts, Status of State Action on the Medicaid Expansion Decision, available at
https://www.kff.org/health-reform/state-indicator/state-activity-around-expanding-medicaid-under-the-affordable-care-
act/?currentTimeframe=0&sortModel=%7B%22colId%22:%22Location%22,%22sort%22:%22asc%22%7D (downloaded
February 4, 2021).
8
Estimates of nongroup coverage are higher in the American Community Survey than in other data sources. Turner, J.,
and M. Boudreaux. "Health Insurance Coverage in the American Community Survey: A Comparison to Two Other Federal
Surveys." National Academies Press. 2010.
9
Uberoi, N et al. Health Insurance Coverage and the Affordable Care Act, 2010-2016. HHS ASPE Brief, March 3, 2016.
Accessed at: https://aspe.hhs.gov/system/files/pdf/187551/ACA2010-2016.pdf
.
10
Garfield, R. et al. The Uninsured and the ACA: A Primer – Key Facts about Health Insurance and the uninsured amidst
Changes to the Affordable Care Act. Kaiser Family Foundation, January 25, 2019. Accessed at:
https://www.kff.org/racial-
equity-and-health-policy/issue-brief/changes-in-health-coverage-by-race-and-ethnicity-since-the-aca-2010-2018/.
11
Analysis of Recent Declines in Medicaid and CHIP Enrollment. Kaiser Family Foundation, November 25, 2019. Accessed
at: https://www.kff.org/medicaid/fact-sheet/analysis-of-recent-declines-in-medicaid-and-chip-enrollment/
.
12
Broaddus, M. (2019). Research Note: Medicaid Enrollment Decline Among Adults and Children Too Large to Be
Explained by Falling Unemployment. Center on Budget and Policy Priorities.
13
Pollitz et al. Limited Navigator Funding for Federal Marketplace States. Kaiser Family Foundation, November 2019.
Accessed at:
https://www.kff.org/private-insurance/issue-brief/data-note-further-reductions-in-navigator-funding-for-
federal-marketplace-states/; Tolbert, J. et al. Impact of Shifting Immigration Policy on Medicaid Enrollment and Utilization
of Care among Health Center Patients. Kaiser Family Foundation, October 2019. Accessed at:
https://www.kff.org/medicaid/issue-brief/impact-of-shifting-immigration-policy-on-medicaid-enrollment-and-utilization-
of-care-among-health-center-patients/.
14
Health Management Associates. COVID-19 Impact on Medicaid, Marketplace, and the Uninsured, May 2020. Accessed
at:
https://www.healthmanagement.com/wp-content/uploads/HMA-Updated-Estimates-of-COVID-Impact-on-Health-
Insurance-Coverage-May-2020.pdf; Dorn, S. The COVID-19 Pandemic and Resulting Economic Crash Have Caused the
Greatest Health Insurance Losses in American History, July 17, 2020. Families USA Accessed at:
https://familiesusa.org/wp-content/uploads/2020/07/COV-254_Coverage-Loss_Report_7-17-20.pdf;
Garfield, R., et al. Eligibility for ACA Health Coverage Following Job Loss, May 13, 2020. The Kaiser Family Foundation.
Accessed at: https://www.kff.org/coronavirus-covid-19/issue-brief/eligibility-for-aca-health-coverage-following-job-loss/
;
Garrett, B and Gangopadhyaya, A. How the COVID-19 Recession Could Affect Health Insurance Coverage, May 4, 2020.
The Urban Institute. Accessed at:
https://www.urban.org/research/publication/how-covid-19-recession-could-affect-
health-insurance-coverage; Banthin J., Simpson, M., Buettgens, M., Blumberg, L., and Wang, R. Changes in health
insurance coverage due to the COVID-19 recession: Preliminary estimates using microsimulation. Urban Institute. July 13,
2020. Accessed at:
https://www.urban.org/research/publication/changes-health-insurance-coverage-due-covid-19-
recession.
15
Sara R. Collins, Herman K. Bhupal, and Michelle M. Doty. Health Insurance Coverage Eight Years After the ACA: Fewer
Uninsured Americans and Shorter Coverage Gaps, But More Underinsured — Findings from the Commonwealth Fund
Biennial Health Insurance Survey, 2018. February 2019. The Commonwealth Fund. Accessed at:
https://www.commonwealthfund.org/sites/default/files/2019-02/PDF_Collins_2018_biennial_topline_exhibits.pdf
.
16
Collins, S., Gunja, M., and Aboulafia, G. U.S. Health Insurance Coverage in 2020: A Looming Crisis in Affordability. August
19, 2020. Accessed at:
https://www.commonwealthfund.org/publications/issue-briefs/2020/aug/looming-crisis-health-
coverage-2020-biennial.
17
Estimates from the Household Pulse Survey are not directly comparable to estimates from NHIS or ACS due to
differences in methodology. For example, “don’t know” or missing survey responses are imputed in the NHIS and ACS
data, but not in the Pulse data, and the Household Pulse Survey estimates do not include children. U.S. Census Bureau.
Household Pulse Survey Data Tables. January 23, 2021. Accessed at:
https://www.census.gov/programs-
surveys/household-pulse-survey/data.html.
Centers for Diseases Control and Prevention, National Center for Health Statistics. Health Insurance Coverage, Household
Pulse Survey. January 27, 2021. Accessed at: https://www.cdc.gov/nchs/covid19/pulse/health-insurance-coverage.htm

February 2021
ISSUE BRIEF
18
18
U.S. Bureau of Labor Statistics. Employment Situation News Release, January 2021. Accessed at:
https://www.bls.gov/news.release/archives/empsit_02052021.htm
.
19
Congressional Budget Office. Federal Subsidies for Health Coverage for People Under 65: 2020 to 2030. September 29,
2020. Accessed at: https://www.cbo.gov/publication/56571
.
20
Agarwal, S.D., and Sommers, B.D., Insurance Coverage after Job Loss — The Importance of the ACA during the Covid-
Associated Recession, New England Journal of Medicine 383:1603-1606, October 22, 2020
(https://www.nejm.org/doi/full/10.1056/NEJMp2023312
).
21
Parker, K., Minkin, R., and Bennett, J. Economic Fallout From COVID-19 Continues To Hit Lower-Income Americans the
Hardest, September 24, 2020. Pew Research Center. Accessed at
https://www.pewsocialtrends.org/2020/09/24/economic-fallout-from-covid-19-continues-to-hit-lower-income-
americans-the-
hardest/#:~:text=Overall%2C%2025%25%20of%20U.S.%20adults,has%20occurred%20in%20their%20household
22
U.S. Bureau of Labor Statistics. Unemployment rate falls to 6.9 percent in October 2020. TED: The Economics Daily.
Accessed at:
https://www.bls.gov/opub/ted/2020/unemployment-rate-falls-to-6-point-9-percent-in-october-
2020.htm#:~:text=That%20was%20the%20sixth%20consecutive,and%208.8%20percent%20for%20Hispanics.
23
Rakotoniaina, A. How States are Increasing Coverage through Special Enrollment Periods. National Academy for State
Health Policy, September 28, 2020. Accessed at:
https://www.nashp.org/how-states-are-increasing-coverage-through-
special-enrollment-periods/.
24
Centers for Medicare and Medicaid Services. Medicaid and CHIP Enrollment Trends Snapshot through September
2020.Accesed at:
https://www.medicaid.gov/medicaid/national-medicaid-chip-program-
information/downloads/september-medicaid-chip-enrollment-trend-snapshot.pdf .
25
Berchick, E., Mykyta, L and Stern, S. The Influence of COVID-19-related Data Collection Changes on Measuring Health
Insurance Coverage in the 2020 CPS ASEC. September 15, 2020. US Census Bureau. Accessed at:
https://www.census.gov/library/working-papers/2020/demo/SEHSD-WP2020-13.html
Dahlhamer, J.M., Bramlett, M.D., Maitland, A. and Blumberg, S. Preliminary Evaluation of Nonresponse
Bias Due to the COVID-19 Pandemic on National Health Interview Survey Estimates, April-June 2020. February 2021.
Accessed at: https://www.cdc.gov/nchs/data/nhis/earlyrelease/nonresponse202102-508.pdf
26
National Center for Health Statistics, National Health Interview Survey (NHIS). 2020 NHSI. February 4, 2021. Accessed
at: https://www.cdc.gov/nchs/nhis/2020nhis.htm
.
27
Uberoi, N et al. Health Insurance Coverage and the Affordable Care Act, 2010-2016. HHS ASPE Brief, March 3, 2016.
Accessed at: https://aspe.hhs.gov/system/files/pdf/187551/ACA2010-2016.pdf
.
28
McIntyre, A., Brault, M.W., Sommers, B.D. Measuring Coverage Rates in a Pandemic: Policy and Research Challenges.
JAMA Health Forum. Published online October 26, 2020. Accessed at: doi:10.1001/jamahealthforum.2020.1278
29
Strengthening Medicaid and Affordable Care Act. White House Executive Order, January 28, 2021. Accessed at:
https://www.whitehouse.gov/briefing-room/presidential-actions/2021/01/28/executive-order-on-strengthening-
medicaid-and-the-affordable-care-act/.
30
See state profiles at https://www.healthinsurance.org/states/ and https://agency.accesshealthct.com/access-health-ct-
announces-a-special-enrollment-period-for-uninsured-residents-due-to-ongoing-public-health-crisis.
31
Lueck, S. and Broaddus, M. Emergency Special Enrollment Period Would Boost Health Coverage Access at a Critical
Time. Center on Budget and Policy Priorities, July 30, 2020. Accessed at:
https://www.cbpp.org/research/health/emergency-special-enrollment-period-would-boost-health-coverage-access-at-a-
critical.
Special Trends Report: Enrollment Data and Coverage Options for Consumers During the COVID-19 Public Health
Emergency. Centers for Medicare & Medicaid Services Center for Consumer Information and Insurance Oversight,
November 2020. Accessed at:
https://www.cms.gov/CCIIO/Resources/Forms-Reports-and-Other-
Resources/Downloads/SEP-Report-Nov-2020.pdf.
32
Haley, JM. and Wengle E. Many Uninsured Adults Have Not Tried to Enroll in Medicaid or Marketplace Coverage. Robert
Wood Johnson Foundation, January 28, 2021. Accessed at:
https://www.urban.org/research/publication/many-
uninsured-adults-have-not-tried-enroll-medicaid-or-marketplace-coverage.
33
Pollitz, K. and Tolbert, J. Opportunities and Resources to expand Enrollment During the Pandemic and Beyond. Kaiser
Family Foundation, January 25, 2021. Accessed at:
https://www.kff.org/health-reform/issue-brief/opportunities-and-
resources-to-expand-enrollment-during-the-pandemic-and-beyond/.

February 2021
ISSUE BRIEF
19
34
Cha, A. and Cohen, R. Reasons for Being Uninsured Among Adults Aged 18-64 in the U.S., 2019. National Health
Interview Survey, September 2020. Accessed at: https://www.cdc.gov/nchs/products/databriefs/db382.htm
.
35
Lee, P. et al. Marketing Matters: How Marketing and Outreach Builds Stable Marketplaces and Pays Off for the Federal
Government, 2017. Accessed at:
https://hbex.coveredca.com/data-research/library/CoveredCA_Marketing_Matters_9-
17.pdf.
36
Pollitz, K. and Tolbert, J. Opportunities and Resources to expand Enrollment During the Pandemic and Beyond. Kaiser
Family Foundation, January 25, 2021. Accessed at:
https://www.kff.org/health-reform/issue-brief/opportunities-and-
resources-to-expand-enrollment-during-the-pandemic-and-beyond/.
37
Pollitz, K. and Tolbert, J. Opportunities and Resources to expand Enrollment During the Pandemic and Beyond. Kaiser
Family Foundation, January 25, 2021. Accessed at:
https://www.kff.org/health-reform/issue-brief/opportunities-and-
resources-to-expand-enrollment-during-the-pandemic-and-beyond/.

February 2021
ISSUE BRIEF
20
U.S. DEPARTMENT OF HEALTH AND HUMAN SERVICES
Office of the Assistant Secretary for Planning and Evaluation
200 Independence Avenue SW, Mailstop 447D
Washington, D.C. 20201
For more ASPE briefs and other publications, visit:
aspe.hhs.gov/reports
ABOUT THE AUTHORS
Kenneth Finegold is a Senior Social Science Analyst in the Office
of Health Policy in the Office of the Assistant Secretary for
Planning and Evaluation.
Ann Conmy is a Social Science Analyst in the Office of Health
Policy in the Office of the Assistant Secretary for Planning and
Evaluation.
Rose Chu is a Program Analyst in the Office of Health Policy in the
Office of the Assistant Secretary for Planning and Evaluation.
Arielle Bosworth is an Economist in the Office of Health Policy in
the Office of the Assistant Secretary for Planning and Evaluation.
Benjamin D. Sommers is the Deputy Assistant Secretary for the
Office of Health Policy in the Office of the Assistant Secretary for
Planning and Evaluation.
SUGGESTED CITATION
Finegold K, Conmy A, Chu RC, Bosworth A, and Sommers, BD.
Trends in the U.S. Uninsured Population, 2010-2020. (Issue Brief
No. HP-2021-02). Washington, DC: Office of the Assistant
Secretary for Planning and Evaluation, U.S. Department of Health
and Human Services. February 11, 2021.
COPYRIGHT INFORMATION
All material appearing in this report is in the public domain and
may be reproduced or copied without permission; citation as to
source, however, is appreciated.
___________________________________
Subscribe to ASPE mailing list to receive
email updates on new publications:
aspe.hhs.gov/join-mailing-list
For general questions or general
information about ASPE:
aspe.hhs.gov/about
HP-2021-02
