Health Insurance Coverage: Early Release of
Estimates From the National Health Interview Survey, 2014
by Robin A. Cohen, Ph.D., and Michael E. Martinez, M.P.H., M.H.S.A.
Division of Health Interview Statistics, National Center for Health Statistics
Highlights
In 2014, 36.0 million persons of all
ages (11.5%) were uninsured at the
time of interview, 51.6 million
(16.5%) had been uninsured for at
least part of the year prior to
interview, and 26.3 million (8.4%)
had been uninsured for more than a
year at the time of interview.
Among persons under age 65, 63.6%
(170.4 million) were covered by
private health insurance plans at the
time of interview. This includes 2.2%
(5.9 million) covered by private plans
through the Health Insurance
Marketplace or state-based
exchanges at the time of interview
between January and December
2014. The proportion with exchange
coverage increased from 1.4% (3.7
million) in the first quarter of 2014
(January–March) to 2.5% (6.7
million) in the fourth quarter of
2014 (October–December).
Among adults aged 18–64, the
percentage who were uninsured at
the time of interview decreased from
20.4% in 2013 to 16.3% in 2014.
Among adults aged 19–25, the
percentage who were uninsured at
the time of interview decreased from
26.5% in 2013 to 20.0% in 2014.
In 2014, the percentage of persons
under age 65 who were uninsured at
the time of interview varied by state.
For example, 2.5% were uninsured in
Hawaii, whereas 21.5% were
uninsured in Oklahoma and Texas.
Introduction
The Centers for Disease Control and
Prevention’s (CDC) National Center for
Health Statistics (NCHS) is releasing
selected estimates of health insurance
coverage for the civilian
noninstitutionalized U.S. population
based on data from the 2014 National
Health Interview Survey (NHIS), along
with comparable estimates from the
2009–2013 NHIS. Estimates for 2014 are
based on data for 111,682 persons.
Three estimates of lack of health
insurance coverage are provided:
(a) uninsured at the time of interview,
(b) uninsured at least part of the year
prior to interview (which includes
persons uninsured for more than a year),
and (c) uninsured for more than a year at
the time of interview (Tables 1 and 2).
Estimates of public and private coverage
are also presented (Table 3). Table 3 also
includes estimates for 1997 and 2005.
Additional tables present estimates
of uninsurance, public coverage, and
private coverage by poverty status for
persons under age 65 (Table 4), adults
aged 18–64 (Table 5), and children aged
0–17 (Table 6). Table 7 shows the
percentages of persons who were
uninsured, had public coverage, and had
private coverage, by age and sex.
Estimates for persons under age 65, by
race and ethnicity, are shown in Table 8.
Table 9 presents estimates for adults
aged 18–64 by other selected
demographic characteristics that are
relevant to adults only.
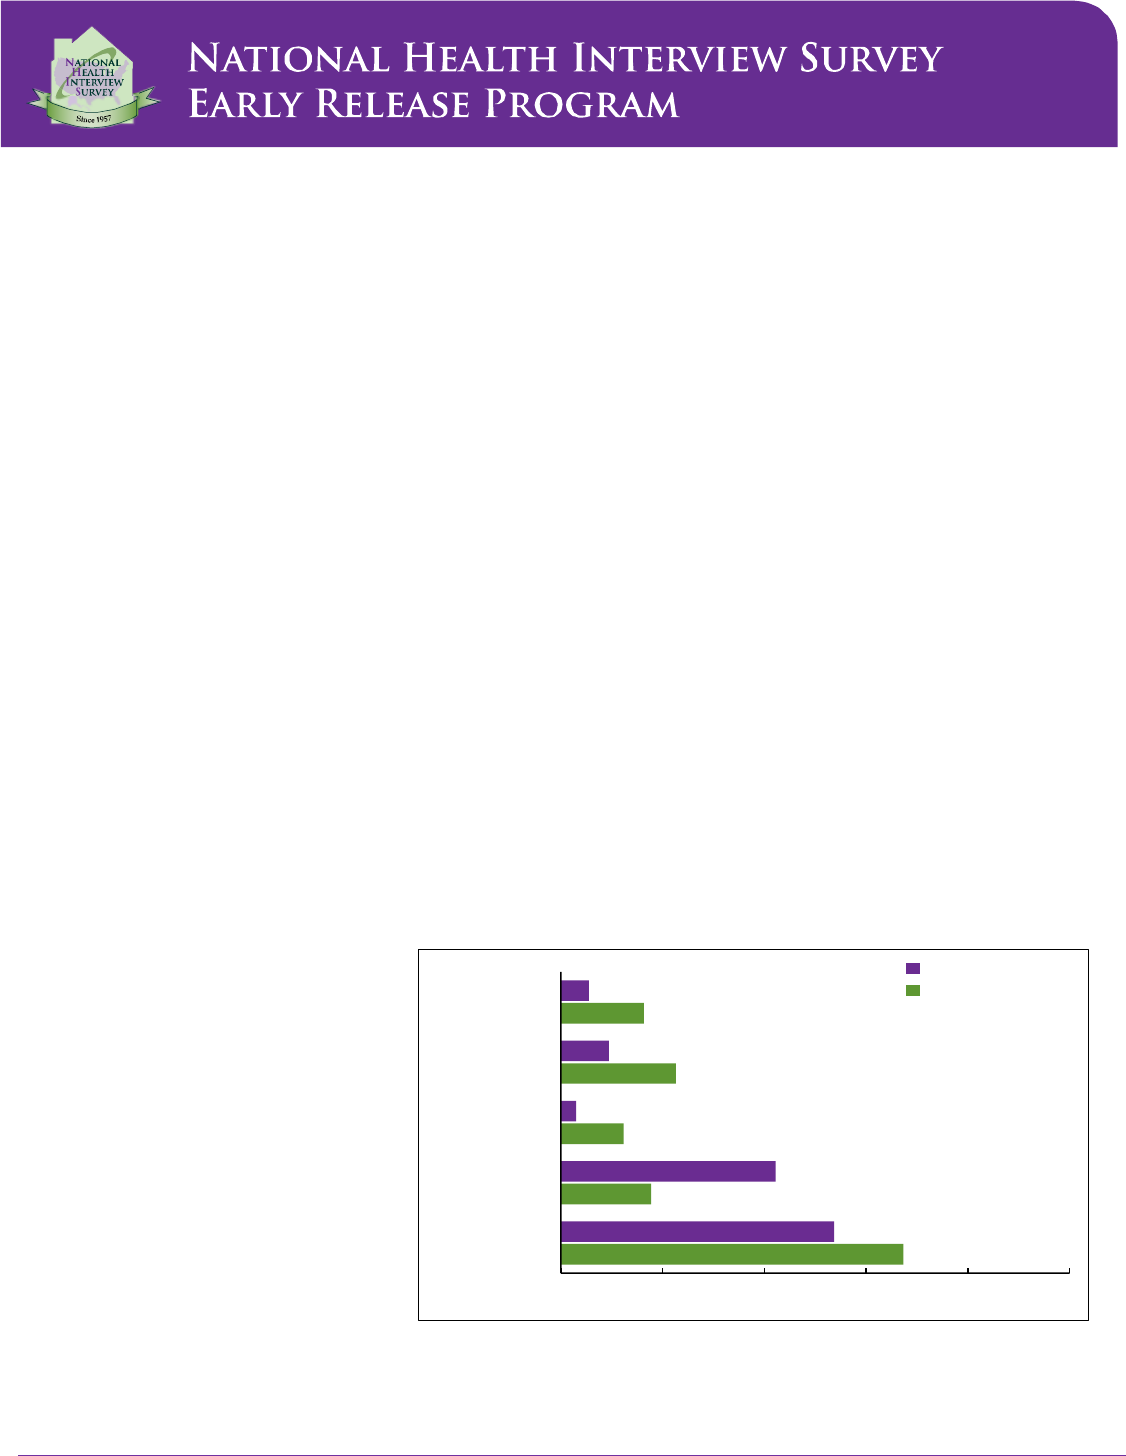
Figure 1. Percentage of persons without health insurance, by age group using three measures of
noncoverage, and percentage of persons with health insurance at time of interview, by
coverage type and age group: United States, 2014
67.3
17.7
12.3
22.6
16.3
53.7
42.2
3.0
9.4
5.5
0 20 40 60 80 100
Private coverage
Public coverage
Uninsured for
more than a year
Uninsured at least
part of the year
Uninsured at time
of interview
Percent
NOTE: Data are based on household interviews of a sample of the civilian noninstitutionalized population.
DATA SOURCE: CDC/NCHS, National Health Interview Survey, 2014, Family Core component.
Children under age 18
Adults aged 18–64
Page | 1 U.S. Department of Health and Human Services ● Centers for Disease Control and Prevention ● National Center for Health Statistics ● Released 6/15
Health Insurance Coverage: Early Release of Estimates From the National Health Interview Survey, 2014
For individuals with private health
insurance, estimates are presented in
Tables 10 and 11 for enrollment in high-
deductible health plans (HDHPs),
enrollment in consumer-directed health
plans (CDHPs), and being in a family
with a flexible spending account (FSA) for
medical expenses.
This report includes four tables that
address regional and state differences.
Tables 12 and 13 present estimates of
uninsurance, public coverage, and private
coverage by each state’s Affordable Care
Act (ACA) of 2010 (P.L. 111–148, P.L.
111–152) implementation
characteristics. Specifically, Table 12
presents estimates by state Medicaid
expansion status as of October 31, 2013.
Table 13 shows estimates by state Health
Insurance Marketplace type. Expanded
regional and state-level estimates of
uninsurance at the time of interview, and
public and private coverage, are
presented in Tables 14 and 15. State-
specific health insurance estimates are
presented for all 50 states and the
District of Columbia for persons of all
ages, persons under age 65, and adults
aged 18–64; and for 40 states for children
aged 0–17.
Most of the tables in this report
provide estimates prior to and after
implementation of the Health Insurance
Marketplaces and Medicaid expansion
provisions that began in January 2014.
The 2014 estimates after implementation
are based on a full year of data collected
from January through December 2014
and, therefore, are centered around the
midpoint of this period.
This report is updated quarterly and
is part of the NHIS Early Release (ER)
Program, which releases updated selected
estimates that are available from the
NHIS website at:
http://www.cdc.gov/nchs/nhis.htm.
Estimates for each calendar quarter, by
selected demographics, are also available
as a separate set of tables through the ER
program. For more information about
NHIS and the ER Program, see the
Technical Notes and the Additional Early
Release Program Products sections at the
end of this report.
Results
Lack of health insurance
coverage
In 2014, the percentage of persons
uninsured at the time of interview was
11.5% (36.0 million) for persons of all
ages, 13.3% (35.7 million) for persons
under age 65, 5.5% (4.0 million) for
children aged 0–17, 16.3% (31.7 million)
for adults aged 18–64, and 20.0% (6.0
million) for adults aged 19–25 (Tables 1
and 2). Adults aged 18–64 were almost
three times as likely as children to be
uninsured at the time of interview
(Table 1 and Figure 1).
The percentage of persons
uninsured for at least part of the year was
16.5% (51.6 million) for persons of all
ages, based on data from 2014 (Tables 1
and
2). Among persons under age 65,
19.0% (50.8 million) were uninsured for
at least part of the year. Adults aged 18–
64 were more than twice as likely (22.6%)
as children (9.4%) to experience this lack
of coverage (Table 1 and Figure 1).
Among adults aged 19–25, 26.9% had
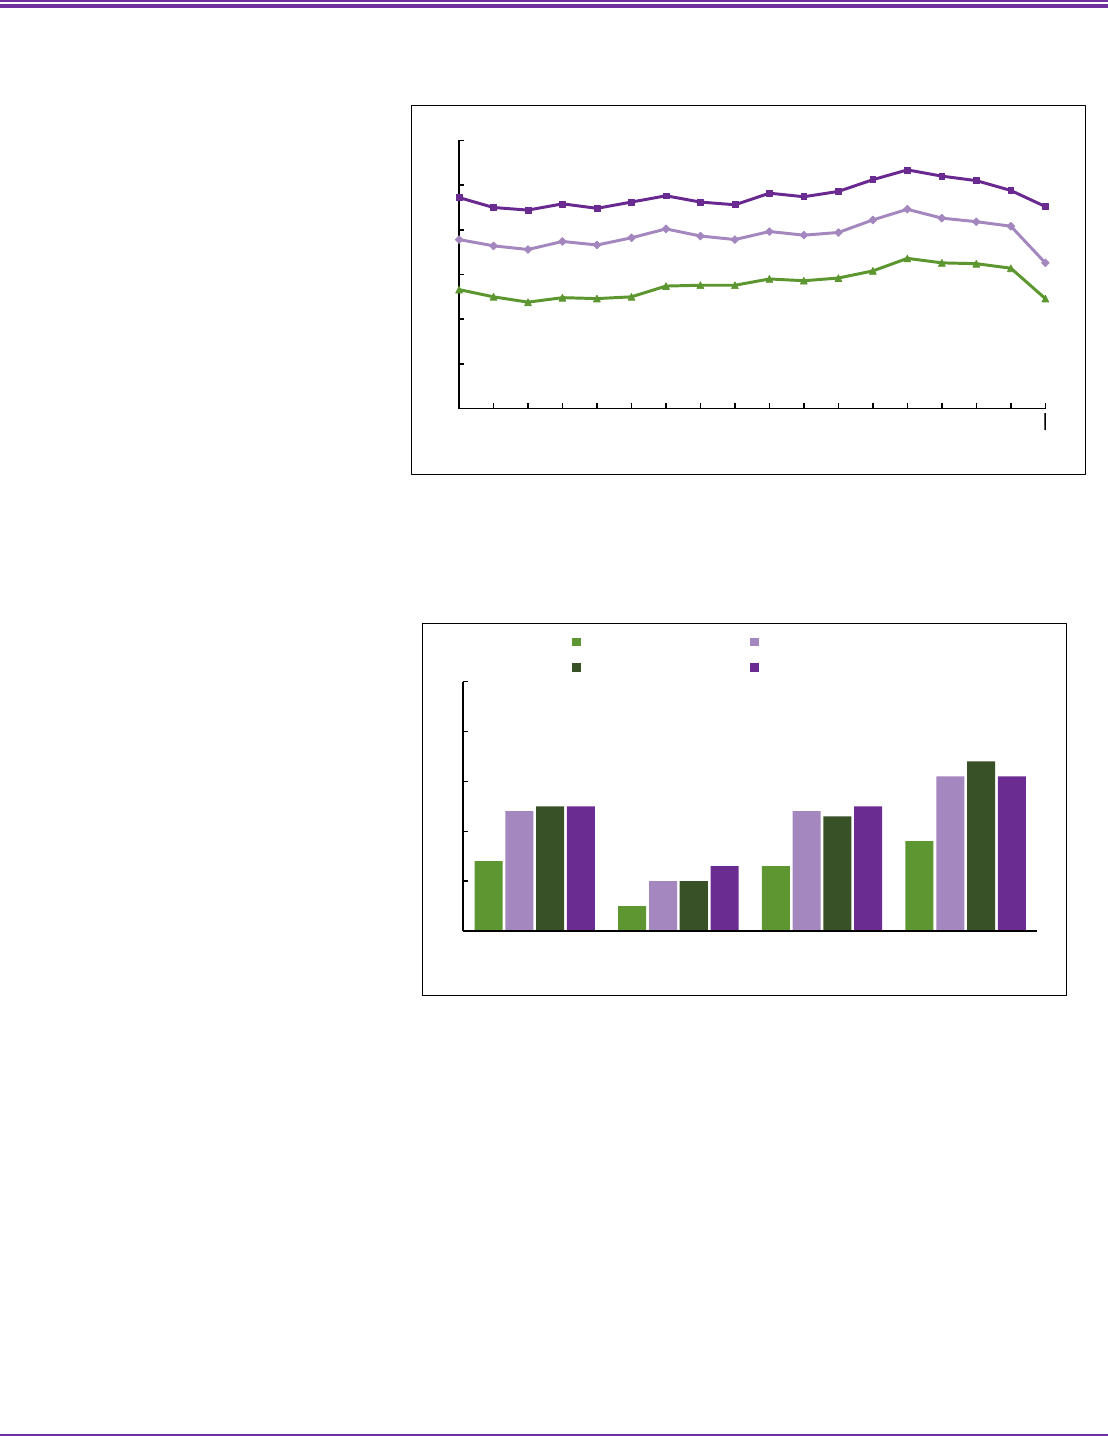
Figure 2. Percentages of adults aged 18–64 who lacked health insurance coverage at time of
interview, for at least part of the past year, or for more than a year: United States, 1997–2014
0
5
10
15
20
25
30
1997 1999 2001 2003 2005 2007 2009 2011 2013
NOTE: Data are based on household interviews of a sample of the civilian noninstitutionalized population.
DATA SOURCE: CDC/NCHS, National Health Interview Survey, 1997–2014, Family Core component.
Percent
For more than a year
At time of interview
For at least part of the past year
2014
Figure 3. Percentage of persons under age 65 with private health insurance obtained through
the Health Insurance Marketplace or state-based exchanges, by age group and quarter: United
States, 2014
1.4
0.5
1.3
1.8
2.4
1.0
2.4
3.1
2.5
1.0
2.3
3.4
2.5
1.3
2.5
3.1
0.0
1.0
2.0
3.0
4.0
5.0
Under 65 Under 18 18–29 30–64
Age group (years)
Quarter 1 (Jan–Mar) Quarter 2 (Apr–Jun)
Quarter 3 (Jul–Sep)
Quarter 4 (Oct–Dec)
Percent
NOTES: Data include persons who have purchased a private health insurance plan through the Health Insurance Marketplace or state-based
exchanges that were established as part of the Affordable Care Act of 2010 (P.L. 111–148, P.L. 111–152). All persons who have exchange-based
coverage are considered to have private health insurance. Data are based on household interviews of a sample of the civilian noninstitutionalized
population.
DATA SOURCE: CDC/NCHS, National Health Interview Survey, 2014, Family Core component.
Page | 2 U.S. Department of Health and Human Services ● Centers for Disease Control and Prevention ● National Center for Health Statistics ● Released 6/15
Health Insurance Coverage: Early Release of Estimates From the National Health Interview Survey, 2014
been uninsured for at least part of the
past year.
Regarding persistent lack of
coverage, 8.4% (26.3 million) of persons
of all ages had been uninsured for more
than a year (Tables 1 and 2). Among
persons under age 65, 9.7% (26.1 million)
had been uninsured for more than a year.
Adults aged 18–64 were more than four
times as likely (12.3%) as children (3.0%)
to have been uninsured for more than a
year (Table 1 and Figure 1). Among adults
aged 19–25, the percentage uninsured for
more than a year was 14.2% (Table 1).
From 2013 to 2014, significant
decreases were noted in the percentages
of persons who were uninsured at the
time of interview among persons of all
ages, those under age 65, those aged 18–
64, those aged 19–25 and children aged
0–17. The largest decrease was for adults
aged 19–25, from 26.5% in 2013 to
20.0% in 2014.
For all age groups except children,
significant decreases were seen in the
percentages of persons who were
uninsured at least part of the year prior
to interview between 2013 and 2014. The
largest decrease was for adults aged 19–
25, from 31.3% in 2013 to 26.9% in
2014.
For all age groups, decreases were
noted from 2013 to 2014 in the
percentage of persons who had been
uninsured for more than a year. For this
measure of persistent lack of coverage,
the largest decrease was for adults aged
19–25, from 19.8% in 2013 to 14.2% in
2014.
The percentages of adults aged
18–64 who were uninsured at the time of
interview, who lacked coverage for at
least part of the past year, and who had
been uninsured for more than a year had
generally increased from 1997 to 2010,
but decreased from 2010 to 2014 (Figure
2).
Among children aged 0–17, the
percentage who were uninsured at the
time of interview has generally decreased,
from 13.9% in 1997 to 5.5% in 2014
(Table 3).
Public and private coverage
In 2014, 24.5% of persons under
age 65 were covered by public health
plans at the time of interview (Table 3).
More than two-fifths of children were
covered by a public plan(42.2%),
compared with 17.7% of adults aged 18–
64 (Table 3 and Figure 1). Public coverage
among adults aged 18–64 increased from
16.7% in 2013 to 17.7% in 2014. Public
coverage among adults aged 19–25 was
19.1% in 2014 (Table 3), a significant
increase from 2013 (16.1%). Between
2013 and 2014, no significant changes
were seen in the percentage of persons
with public coverage among persons of all
ages, those under 65, and children aged
0–17.
Among adults aged 18–64, public
coverage increased between 1997
(10.2%) and 2014 (17.7%) (Table 3).
Among children, the percentage with
public coverage almost doubled between
1997 (21.4%) and 2014 (42.2%).
Among persons under age 65,
63.6% (170.4 million) were covered by
private health insurance plans at the time
of interview in 2014 (
Table 3). This
includes 2.2% (5.9 million) covere
d by
private plans obtained through the
Health Insurance Marketplace or state-
based exchanges. A significant increase
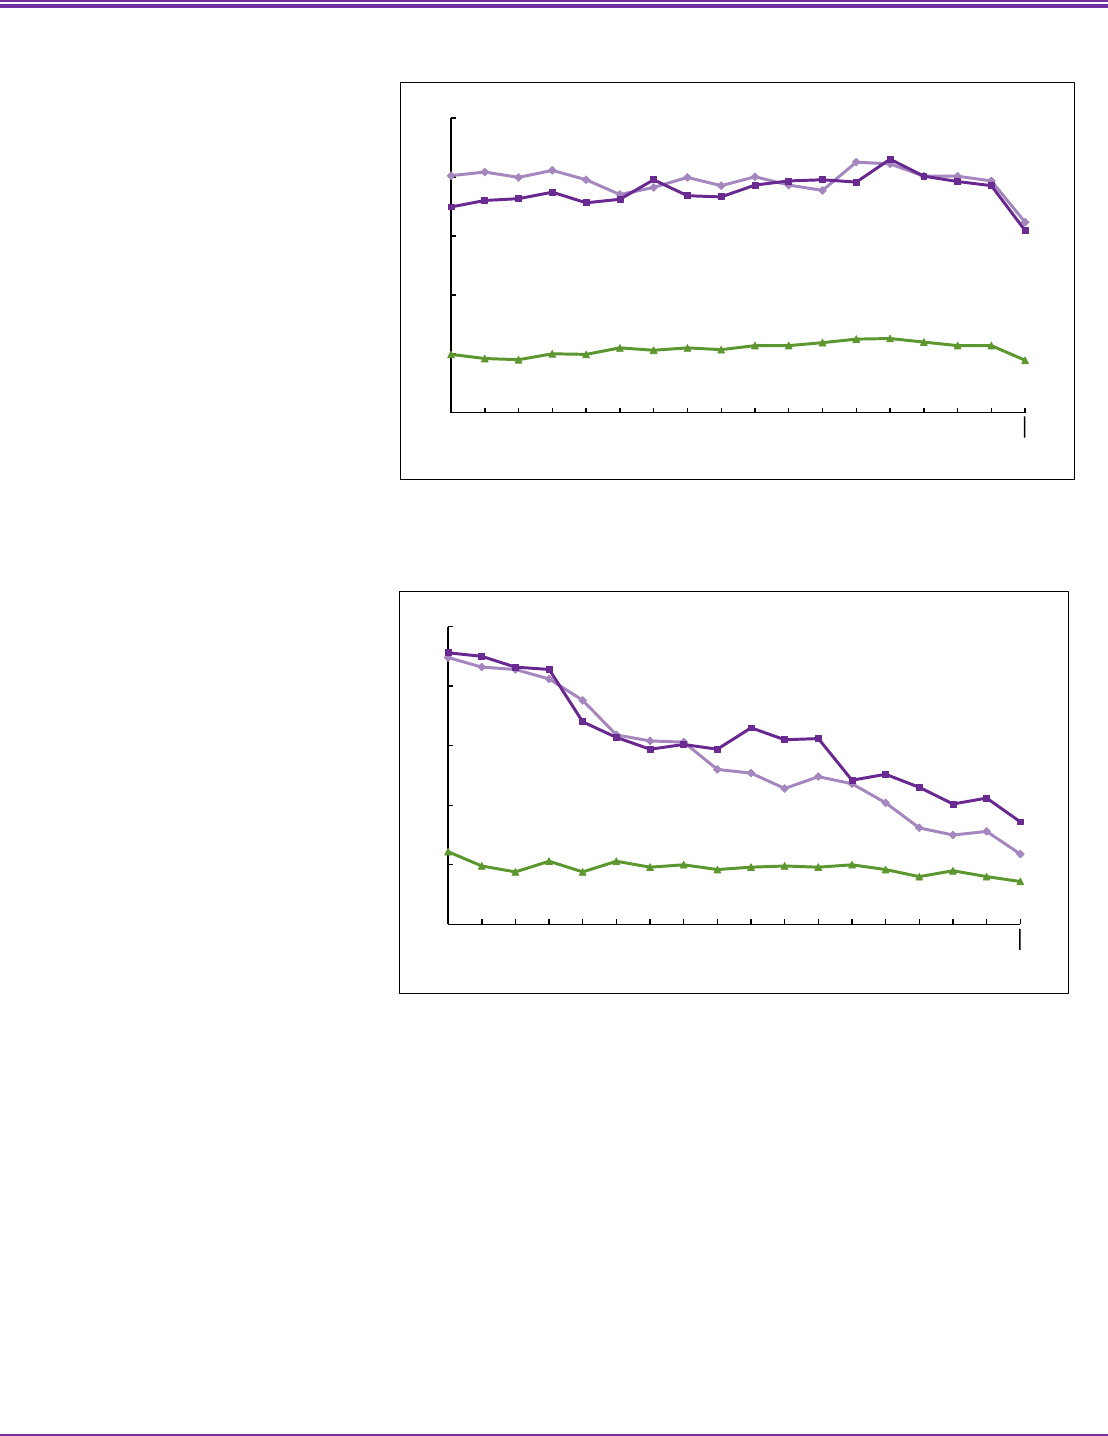
Figure 4. Percentage of adults aged 18–64 who were uninsured at the time of interview, by
poverty status: United States, 1997–2014
0
10
20
30
40
50
1997 1999 2001 2003 2005 2007 2009 2011 2013
2014
NOTE: Data are based on household interviews of a sample of the civilian noninstitutionalized population.
DATA SOURCE: CDC/NCHS, National Health Interview Survey, 1997–2014, Family Core component.
Percent
Poor
Near-poor
Not-poor
Figure 5. Percentage of children under age 18 who were uninsured at the time of interview, by
poverty status: United States, 1997–2014
0
5
10
15
20
25
1997 1999 2001 2003 2005 2007 2009 2011 2013
NOTE: Data are based on household interviews of a sample of the civilian noninstitutionalized population.
DATA SOURCE: CDC/NCHS, National Health Interview Survey, 1997–2014, Family Core component.
Percent
Poor
Near-poor
Not-poor
2014
Page | 3 U.S. Department of Health and Human Services ● Centers for Disease Control and Prevention ● National Center for Health Statistics ● Released 6/15
Health Insurance Coverage: Early Release of Estimates From the National Health Interview Survey, 2014
was noted in the percentage of persons
under age 65 covered by plans obtained
through the Health Insurance
Marketplace or state-based exchanges,
from 1.4% (3.7 million) in the first
quarter of 2014 (January through March)
to 2.5% (6.7 million) in the fourth
quarter of 2014 (October through
December) (Figure 3).
Additional
Health Insurance
Marketplace or state-based exchange
estimates by age, sex, race/ethnicity, and
poverty status are available for the fourth
quarter of 2014 (based on data collected
from October through December)
through the Early Release Program
(http://www.cdc.gov/nchs/data/nhis/
earlyrelease/
Q_Estimates_2010_2014_Q 4.pdf).
More than two-thirds of adults aged
18–64 were covered by a private plan
(67.3%), compared with 53.7% of
children under age 18 (Table 3 and Figure
1). Among adults aged 19–25, 61.9%
were covered by a private plan. Among
adults aged 18–64, 2.7% (5.2 million)
were covered by private plans obtained
through the Health Insurance
Marketplace or state-based exchanges.
Among children under age 18 and adults
aged 19–25, 0.9% and 1.9%, respectively,
were covered by private plans obtained
through the Health Insurance
Marketplace or state-based exchanges.
Among children under age 18, adults
aged 18–29, and adults aged 30–64, a
significant increase was seen in the
percentages with private coverage
obtained through the Health Insurance
Marketplace or state-based exchanges
between the first quarter of 2014
(January through March) and the fourth
quarter of 2014 (October through
December) (Figure 3).
For all age groups except children
aged 0–17, increases were observed
between 2013 and 2014 in the
percentage of persons covered by a
private plan (Table 3).
The percentage with private
coverage generally decreased among
persons under age 65 between 1997 and
2014 (Table 3) but remained stable from
2010 to 2013. Among adults aged 18–64,
private coverage was more than 5
percentage points lo wer in 2014 (67.3%)
than in 1997 (72.8%). Among children,
private coverage decreased between 1997
(66.2%) and 2014 (53.7%).
Health insurance coverage, by
poverty status
In 2014, 22.3% of poor, 23.5% of
near-poor, and 7.6% of not-poor persons
under age 65 did not have health
insurance coverage at the time of
interview (Table 4; see Technical Notes
for a definition of poverty status). During
the same period, 62.1% of poor, 41.1% of
near-poor, and 9.9% of not-poor persons
in this age group had public coverage.
Private coverage was highest among
those who were not-poor (83.7%) and
lowest among those who were poor
(16.6%).
Among adults aged 18–64, 32.3% of
poor, 30.9% of near-poor, and 8.9% of
not-poor adults did not have health
insurance coverage at the time of
interview (Table 5
). During the same
period, 46.6% of poor, 29.6% o
f near-
poor, and 8.5% of not-poor adults in this
age group had public coverage. Private
coverage was highest among those who
were not-poor (83.9%) and lowest among
those who were poor (21.9%).
Among children aged 0–17, 5.9% of
poor, 8.6% of near-poor, and 3.6% of not-
poor children did not have health
insurance coverage at the time of
interview (Table 6). During the same
period, 87.3% of poor, 64.3% of near-
poor, and 14.4% of not-poo r children had
public coverage. Private coverage among
children was highest among those who
were not-poor (83.1%) and lowest among
those who were poor (8.0%).
Among persons under age 65 who
were poor, near-poor, or not-poor, a
significant decrease was seen in the
percentage who were uninsured between
2013 and 2014 (Table 4). For poor
persons under age 65, an increase was
noted from 2013 to 2014 in the
percentage of persons with public
coverage, from 59.0% to 62.1%. For near-
poor and not-poor persons under age 65,
significant increases were seen between
2013 and 2014 in the percentage of
persons covered by a private plan.
Among adults aged 18–64, fo r every
poverty status group, a significant
decrease was seen in the percentage who
were uninsured between 2013 and 2014
(Table 5). Among poor adults aged 18–
64, the percentage who were uninsured
decreased from 39.3% to 32.3%, the
percentage with public coverage
increased from 42.4% to 46.6%, and the
percentage with private coverage
increased from 19.0% to 21.9% from
2013 to 2014.
Among adults in this age group who
were near-poor, the percentage who were
uninsured decreased from 38.5% to
30.9%, the percentage with public
coverage increased from 26.6% to 29.6%,
and the percentage with private coverage
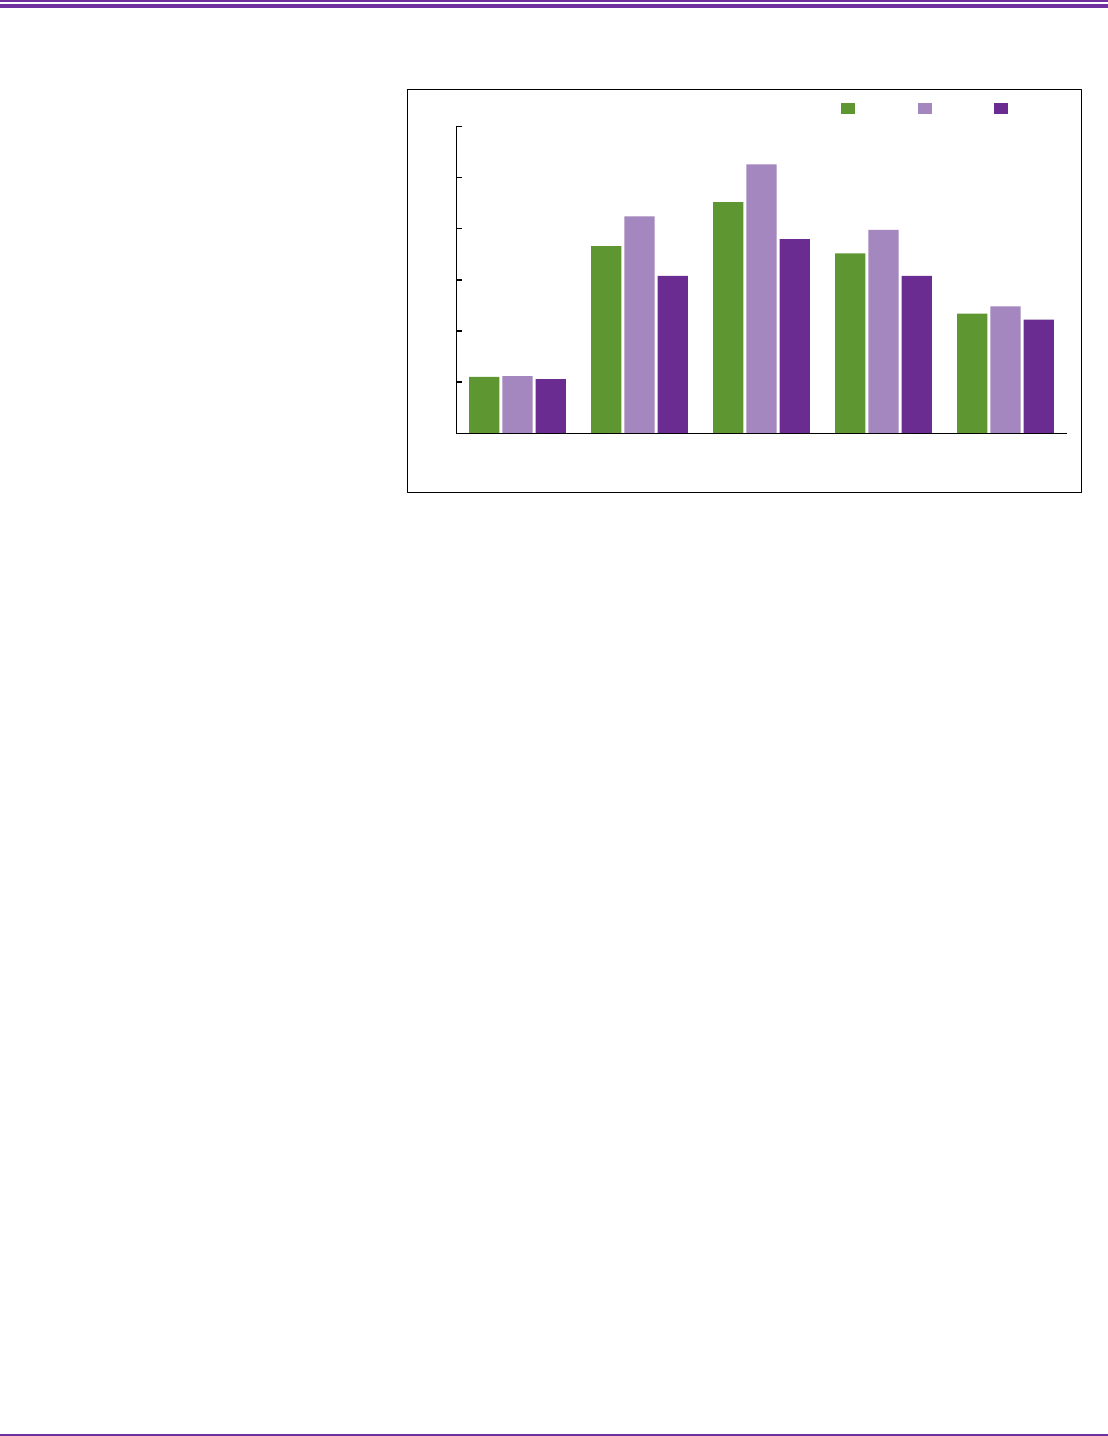
Figure 6. Percentage of persons under age 65 without health insurance coverage at the time of
interview, by age group and sex: United States, 2014
5.5
18.3
22.6
17.6
11.7
5.6
21.2
26.3
19.9
12.4
5.3
15.4
19.0
15.4
11.1
0
5
10
15
20
25
30
Under 18
18–24
25–34
35–44
45–64
Age group (years)
NOTE: Data are based on household interviews of a sample of the civilian noninstitutionalized population.
DATA SOURCE: CDC/NCHS, National Health Interview Survey, 2014, Family Core component.
Percent
Total
Male Female
Page | 4 U.S. Department of Health and Human Services ● Centers for Disease Control and Prevention ● National Center for Health Statistics ● Released 6/15

Health Insurance Coverage: Early Release of Estimates From the National Health Interview Survey, 2014
increased from 36.4% to 41.2% between
2013 and 2014.
Among adults aged 18–64 who were
not-poor, the percentage who were
uninsured decreased from 11.4% to 8.9%
between 2013 and 2014. Private coverage
increased from 81.2% in 2013 to 83.9%
in 2014. There was no change in the
percentage with public coverage from
2013 to 2014.
Among poor and near-poor
children, a significant decrease was noted
in the percentages who were uninsured
between 2013 and 2014 (Table 6). The
percentage who were uninsured
decreased from 7.8% to 5.9% among poor
children between 2013 and 2014. Among
near-poor children, the percentage who
were uninsured decreased from 10.6% to
8.6% between 2013 and 2014. There
were no significant changes in public
coverage among poor, near-poor, and
not-poor children between 2013 and
2014. Among not-poor children, the
percentage with private coverage
increased from 81.2% in 2013 to 83.1%
in 2014. There were no significant
changes in private coverage among
children who were poor or near-poor
between 2013 and 2014.
The percentage of poor adults aged
18–64 who were uninsured remained
relatively stable from 1997 through
2013, with a significant decrease between
2013 and 2014 (Figure 4). Among near-
poor and not-poor adults in this age
group, a generally increasing trend was
seen from 1997 to 2010 in the
percentage who were uninsured.
However, there has been a decreasing
trend from 2010 to 2014 in the
uninsured among near-poor and not-
poor adults.
The percentage of poor and near-
poor children who were uninsured at the
time of interview decreased from 1997
through 2014 (Figure 5). However, the
rate of decline during this period was
greater for poor children. The percentage
of near-poor children who were
uninsured at the time of interview
decreased from 1997 to 2003, remained
relatively stable from 2003 to 2006, and
then decreased from 2006 through 2014.
The percentage of not-poor children who
were uninsured at the time of interview
has generally decreased from 6.1% in
1997 to 3.6% in 2014.
Health insurance coverage, by
selected demographic
characteristics
Age and sex
In 2014, adults aged 25–34 were
the most likely (22.6%) to lack health
insurance coverage at the time of
interview (Table 7). Among persons
under age 65, children aged 0–17 were
the most likely to have public coverage
(42.2%), and adults aged 45–64 were the
most likely to have private coverage
(71.5%). Among adults in age groups 18–
24, 25–34, 35–44, and 45–64, men were
more likely than women to lack health
insurance coverage at the time of
interview (Figure 6).
Race/ethnicity
In 2014, among persons under age
65, 25.2% of Hispanic, 13.5% of non-
Hispanic black, 10.6% of non-Hispanic
Asian, and 9.8% of non-Hispanic white
persons were uninsured at the time of
interview (Table 8). Public coverage was
highest among those who were non-
Hispanic black (40.3%). Private coverage
was highest among those who were non-
Hispanic white (73.6%) and non-
Hispanic Asian (73.4%).
For Hispanic persons under age 65,
the percentage uninsured decreased from
30.3% in 2013 to 25.2% in 2014. For
non-Hispanic white persons under age
65, the percentage uninsured decreased
from 12.1% in 2013 to 9.8% in 2014. For
non-Hispanic black persons under age 65,
the percentage uninsured decreased from
18.9% in 2013 to 13.5% in 2014. For
non-Hispanic Asian persons under age
65, the percentage uninsured decreased
from 13.8% in 2013 to 10.6% in 2014.
Other demographic characteristics
Among adults aged 18–64 who
lacked a high school diploma, 34.0% were
uninsured at the time of interview
(Table 9). This rate is greater than three
times the rate for those with more than a
high school education (10.0%). Public
health plan coverage was highest among
those who lacked a high school diploma
(34.0%) and lowest among those with
more than a high school education
(12.2%). Private coverage was highest
among those who had more than a high
school education (79.1%) and lowest
among those who lacked a high school
diploma (33.3%).
Among currently unemployed
adults aged 18–64, 38.7% lacked
coverage at the time of interview (Table
9). Among employed adults in the same
age group, 14.9% were uninsured. Public
health plan coverage was lowest among
employed adults (9.5%) and highest
among those who were not in the
workforce (41.0%). Among employed
Figure 7. Percentages of persons under age 65 enrolled in a high-deductible health plan without
a health savings account, or in a consumer-directed health plan, among those with private
health insurance coverage: United States, 2009–2014
15.9
17.6
19.9
20.3
22.2
23.6
6.6
7.7
9.2
10.8
11.7
13.3
0
10
20
30
40
2009 2010 2011 2012 2013 2014
NOTES: CDHP is consumer-directed health plan, which is a high-deductible health plan (HDHP) with a health savings account (HSA).
HDHP no HSA is a high-deductible health plan without an HSA. The individual components of HDHPs may not add up to the total due to
rounding. Data are based on household interviews of a sample of the civilian noninstitutionalized population.
DATA SOURCE: CDC/NCHS, National Health Interview Survey, 2009–2014, Family Core component.
Percent
HDHP no HSA
CDHP (HDHP with HSA)
22.5
25.3
29.0
31.1
33.9
36.9
Figure 8. Uninsured at the time of interview, comparing expanded regions and national
percentages for persons under age 65: United States, 2014
NOTES: Expanded regions are based on a subdivision of the four census regions into nine divisions. For this report, the nine census divisions were
modified by moving Delaware, the District of Columbia, and Maryland into the Middle Atlantic Division. Data are based on household interviews of a
sample of the civilian noninstitutionalized population.
DATA SOURCE: CDC/NCHS, National Health Interview Survey, 2014, Family Core component.
Significantly higher
Not significantly different
U.S. total
= 13.3%
Significantly lower
AK
HI
ND
SD
NE
KS
MO
IA
MN
KY
TN
MS
AL
GA
FL
SC
NC
VA
WV
WI
IL
IN
OH
MI
NY
PA
MD
DE
NJ
CT
RI
MA
ME
VT
NH
WA
OR
CA
DC
TX
OK
AR
LA
UT
MT
WY
NV
AZ
CO
NM
ID
Pacific
Mountain
West North
Central
East North
Central
New
England
Middle
Atlantic
South
Atlantic
East South
Central
West South
Central
Page | 5 U.S. Department of Health and Human Services ● Centers for Disease Control and Prevention ● National Center for Health Statistics ● Released 6/15

Health Insurance Coverage: Early Release of Estimates From the National Health Interview Survey, 2014
adults, 76.2% had private coverage. This
rate is almost three times as high as for
those who were unemployed (29.6%).
Adults aged 18–64 with family
income less than 100%, and between
100% and up to and including 138%, of
the federal poverty level (FPL) were the
most likely to be uninsured relative to
other income groups. Adults aged 18–64
with family incomes less than 100% FPL
were the most likely to have public
coverage. Those with family income
greater than 400% FPL were the most
likely to have private health insurance
coverage.
Married adults aged 18–64 were less
likely to be uninsured at the time of
interview than those who were widowed,
divorced, separated, living with a partner,
or never married. Married adults were
also more likely than other marital
groups to have private health coverage.
Estimates of enrollment in
HDHPs, CDHPs, and FSAs
In 2014, 36.9% of persons under
age 65 with private health insurance were
enrolled in an HDHP, including 13.3%
who were enrolled in a CDHP (an HDHP
with a health savings account [HSA]) and
23.6% who were enrolled in an HDHP
without an HSA (Figure 7 and Table 10).
(See Technical Notes for definitions of
HDHP, CDHP, and HSA.) Among those
with private insurance, the percentage
who were enrolled in an HDHP increased
between 2013 (33.9%) and 2014 (36.9%).
HDHPs constitute a significant
share of both employment-based and
directly purchased health plans. Based on
data from 2014, among persons under
age 65 with private health insurance,
36.2% with employment-based coverage
were enrolled in an HDHP (Table 11), an
increase from 2013 (32.0%). Also in that
age group, 54.1% with directly purchased
private health plans were enrolled in an
HDHP in 2014. This was a decrease from
2013 (56.4%).
In 2014, among persons under age
65 with private health insurance, 21.2%
were in a family that had an FSA for
medical expenses (Table 10). (See
Technical Notes for definition of FSA.)
Health insurance coverage, by
state Medicaid expansion
status
Under provisions of ACA, states
have the option to expand Medicaid
coverage to those with low income.
Health insurance estimates by state
Medicaid expansion status (as of October
31, 2013), including the District of
Columbia, are presented for all persons
under age 65, children aged 0–17, and
adults aged 18–64 (Table 12). (See
Technical Notes for definitions of
Medicaid expansion status.)
In 2014, adults aged 18–64 residing
in Medicaid expansion states were less
likely to be uninsured than those re sid ing
in nonexpansion states. In Medicaid
expansion states, the percentage o f t hose
uninsured decreased from 18.4% in 2013
to 13.3% in 2014. In nonexpansion
states, the percentage uninsured
decreased from 22.7% in 2013 to 19.6%
in 2014.
In 2014, adults aged 18–64 in
Medicaid expansion states were more
likely to have public coverage (19.9%)
than those in nonexpansion states
(15.3%). In Medicaid expansion states, an
increase was observed in public coverage
from 17.7% in 2013 to 19.9% in 2014. In
nonexpansion states, there was no
significant change in public coverage
between 2013 and 2014.
In 2014, among adults aged 18–64,
those in Medicaid expansion states were
more likely to have private coverage
(68.1%) than those in nonexpansion
states (66.5%). Among adults aged 18–64
in Medicaid expansion states, the
percentage with private coverage
increased from 65.2% in 2013 to 68.1%
in 2014. Among adults aged 18–64 in
nonexpansion states, the percentage with
private coverage increased from 63.2% in
2013 to 66.5% in 2014.
Health insurance coverage, by
state Health Insurance
Marketplace type
Health insurance estimates by state
Health Insurance Marketplace type (as of
October 31, 2013), including the District
of Columbia, are presented for all persons
under age 65, children aged 0–17, and
adults aged 18–64 (Table 13). (See
Technical Notes for definitions of
Marketplace types.) In 2014, adults aged
18–64 in states with a federally
facilitated Marketplace were more likely
to be uninsured than those in states with
a state-based Marketplace or states with
a partnership Marketplace. Decreases
were seen in the uninsured rates between
2013 and 2014 in states with a state-
based Marketplace, a partnership
Marketplace, and a federally facilitated
Marketplace for persons under age 65
and for adults aged 18–64. For children
in states with a state-based Marketplace,
a decrease was noted in the uninsured
rate between 2013 and 2014.
In 2014, adults aged 18–64 in states
with a state-based Marketplace were
more likely to have public coverage than
those in states with a partnership
Marketplace or federally facilitated
Marketplace. Among those in states with
a state-based Marketplace, the
percentage with public coverage
increased from 18.4% in 2013 to 20.6%
in 2014. There were no significant
changes between 2013 and 2014 in the
percentages of adults aged 18–64 with
public coverage in states with a
partnership Marketplace or federally
facilitated Marketplace.
In 2014, adults aged 18–64 in states
with a partnership Marketplace were
more likely to have private coverage than
those in states with state-based
exchanges or those in states with a
federally facilitated Marketplace. Amo ng
those in states with a federally facilitated
Marketplace, the percentage with private
coverage increased from 63.6% in 2013
to 66.9% in 2014. Among those in states
with a state-based Marketplace, the
percentage with private coverage
increased from 64.1% in 2013 to 67.0%
in 2014.
Health insurance coverage in
regions and states
The U.S. Census Bureau divides the
United States into four regions. Based on
data from 2014 NHIS, lack of health
insurance coverage at the time of
interview among adults aged 18–64 was
greatest in the South region (20.7%)
(Table 9). The highest rates of public
coverage were in the Northeast (19.2%)
and West (18.9%), and the highest rates
of private coverage were in the Northeast
(70.9%) and Midwest (71.9%).
Page | 6 U.S. Department of Health and Human Services ● Centers for Disease Control and Prevention ● National Center for Health Statistics ● Released 6/15

Health Insurance Coverage: Early Release of Estimates From the National Health Interview Survey, 2014
Alternatively, the United States may
be divided into nine expanded regions
(Figure 8). Table 14 presents health
insurance estimates for persons of all
ages, persons under age 65, adults aged
18–64, and children aged 0–17 for these
nine expanded regions. (See Technical
Notes for definitions of the expanded
regions, which are similar to but not
exactly the same as Census divisions.)
In 2014, for persons under age 65,
rates of uninsurance at the time of
interview were significantly higher than
the national average of 13.3% in the
South Atlantic and West South Central
regions (Table 7). By contrast, rates of
uninsurance were significantly lower
than the national average in the New
England, Middle Atlantic, East North
Central, and West North Central regions.
In the United States overall, 24.5%
of persons under age 65 had public
coverage. Public coverage rates for this
age group ranged from 19.1% in the West
North Central region to 29.5% in t he East
South Central region (Table 14). The
West North Central and West So uth
Central regions had rates that were
significantly lower than the national
average. The East South Central and
Pacific regions had rates that were
significantly above the national average.
In the United States overall, 63.6%
of persons under age 65 had private
coverage. Private coverage rates for this
age group ranged from 58.5% in the West
South Central region to 72.4% in the
West North Central region (Table 14).
The New England, Middle Atlantic, East
North Central, and West North Central
regions had rates significantly above the
national average. In contrast, rates of
private coverage were significantly lower
than the national average in the South
Atlantic and West South Central regions.
State-specific health insurance
estimates are presented for all 50 states
and the District of Columbia for persons
of all ages, persons under age 65, and
adults aged 18–64, and for 40 states for
children aged 0–17 (Table 15). Estimates
are not presented for all 50 states and the
District of Columbia for children due to
considerations of sample size and
precision.
Nationally, in 2014, 13.3% of
persons under age 65 lacked health
insurance coverage at the time of
interview (Table 15). Rates of
uninsurance were significantly higher
than the national average in Alaska,
Arizona, Florida, Mississippi, Nevada,
North Carolina, Oklahoma, and Texas. By
contrast, rates of uninsurance at the time
of interview in Connecticut, Delaware,
District of Columbia, Hawaii, Iowa,
Maryland, Massachusetts, Michigan,
Minnesota, New Hampshire, New Jersey,
New York, North Dakota, Ohio,
Pennsylvania, Rhode Island, Vermont,
West Virginia, and Wisconsin were
significantly lower than the national
average of 13.3%.
In the United States overall in 2014,
5.5% of children lacked coverage at the
time of interview, but among the 40
states shown in Table 15, rates were
significantly higher than the national
average in Arizona, Nevada, Oklahoma,
Texas, and Utah. In contrast, rates of
uninsurance at the time of interview in
Indiana, Maryland, Massachusetts,
Michigan, Minnesota, Pennsylvania, and
West Virginia were significantly lower
than the national average of 5.5%.
References
1. U.S. Government Accountability
Office. Consumer-directed health
plans: Early enrollee experiences
with health savings accounts and
eligible health plans. GAO–06–798.
Washington, DC. GAO. 2006.
2. Joinpoint Regression Program,
version 4.0.1 [computer software].
Bethesda, MD: Statistical Research
and Applications Branch, National
Cancer Institute. 2013.
3. DeNavas-Walt C, Proctor BD, Smith
JC. Income, poverty, and health
insurance coverage in the United
States: 2008. U.S. Census Bureau.
Current Population Reports, P60–
236. Washington, DC: U.S.
Government Printing Office. 2009.
4. DeNavas-Walt C, Proctor BD, Smith
JC. Income, poverty, and health
insurance coverage in the United
States: 2009. U.S. Census Bureau.
Current Population Reports, P60–
238. Washington, DC: U.S.
Government Printing Office. 2010.
5. DeNavas-Walt C, Proctor BD, Smith
JC. Income, poverty, and health
insurance coverage in the United
States: 2010. U.S. Census Bureau.
Current Population Reports, P60–
239. Washington, DC: U.S.
Government Printing Office. 2011.
6. DeNavas-Walt C, Proctor BD, Smith
JC. Income, poverty, and health
insurance coverage in the United
States: 2011. U.S. Census Bureau.
Current Population Reports, P60–
243. Washington, DC: U.S.
Government Printing Office. 2012.
7. DeNavas-Walt C, Proctor BD, Smith
JC. Income, poverty, and health
insurance coverage in the United
States: 2012. U.S. Census Bureau.
Current Population Reports, P60–
245. Washington, DC: U.S.
Government Printing Office. 2013.
8. DeNavas-Walt C, Proctor BD. Income
and poverty in the United States:
2013. U.S. Census Bureau. Current
Population Reports, P60–249.
Washington, DC: U.S. Government
Printing Office. 2014.
9. National Center for Health Statistics.
Health, United States, 2013: With
special feature on prescription drugs.
Hyattsville, MD. 2014. Available
from:
http://www.cdc.gov/nchs/data/hus/
hus13.pdf.
10. Holahan J, Buettgens M, Caroll C,
Dorn S. The cost and coverage
implications of the ACA Medicaid
expansion: National and state-by-
state analysis. Kaiser Commission on
Medicaid and the Uninsured. 2012.
Available from:
http://kaiserfamilyfoundation.files.
wordpress.com/2013/01/8384.pdf.
11. Ward BW, Clarke TC, Freeman G,
Schiller JS. Early release of selected
estimates based on data from the
2014 National Health Interview
Survey. National Center for Health
Statistics. June 2015. Available
from:
http://www.cdc.gov/nchs/nhis/
releases.htm.
12. Blumberg SJ, Luke JV. Wireless
substitution: Early release of
estimates based on data from the
National Health Interview Survey,
July–December 2014. National
Center for Health Statistics. June
2015. Available from:
http://www.cdc.gov/nchs/nhis.htm
.
Page | 7 U.S. Department of Health and Human Services ● Centers for Disease Control and Prevention ● National Center for Health Statistics ● Released 6/15

Health Insurance Coverage: Early Release of Estimates From the National Health Interview Survey, 2014
Table 1. Percentages of persons who lacked health insurance coverage at the time of interview, for at least part of the past year, and
for more than a year, by age group and year: United States, 2009–2014
Age group and year
Uninsured
1
at
the time of interview
Uninsured
1
for at least
part of the past year
2
Uninsured
1
for
more than a year
2
Percent (standard error)
All ages
2009
15.4 (0.30) 19.4 (0.32) 10.9 (0.26)
2010
16.0 (0.27) 19.8 (0.29) 11.7 (0.22)
2011
15.1 (0.25) 19.2 (0.29) 11.2 (0.21)
2012 14.7 (0.23) 18.6 (0.27) 11.1 (0.22)
2013 14.4 (0.26) 17.8 (0.27) 10.7 (0.23)
2014 11.5 (0.23) 16.5 (0.25) 8.4 (0.19)
Under 65 years
2009
17.5 (0.34) 22.0 (0.36) 12.4 (0.29)
2010
18.2 (0.30) 22.5 (0.33) 13.3 (0.24)
2011 17.3 (0.29) 21.8 (0.33) 12.7 (0.25)
2012 16.9 (0.27) 21.3 (0.31) 12.7 (0.24)
2013 16.6 (0.30) 20.4 (0.32) 12.4 (0.27)
2014 13.3 (0.26) 19.0 (0.29) 9.7 (0.22)
0–17 years
2009 8.2 (0.40) 12.8 (0.47) 4.8 (0.31)
2010 7.8 (0.32) 11.6 (0.37) 4.5 (0.23)
2011 7.0 (0.27) 10.9 (0.36) 3.7 (0.19)
2012 6.6 (0.27) 10.4 (0.35) 3.7 (0.19)
2013 6.5 (0.26) 10.0 (0.33) 3.6 (0.20)
2014 5.5 (0.27) 9.4 (0.40) 3.0 (0.19)
18–64 years
2009
21.1 (0.37) 25.6 (0.38) 15.4 (0.34)
2010
22.3 (0.35) 26.7 (0.37) 16.8 (0.30)
2011
21.3 (0.34) 26.0 (0.37) 16.3 (0.31)
2012 20.9 (0.31) 25.5 (0.34) 16.2 (0.29)
2013 20.4 (0.37) 24.4 (0.38) 15.7 (0.34)
2014 16.3 (0.31) 22.6 (0.34) 12.3 (0.27)
19–25 years
2009
32.7 (0.82) 40.3 (0.87) 22.0 (0.74)
2010
33.9 (0.73) 41.7 (0.78) 24.1 (0.61)
2011
27.9 (0.71) 36.1 (0.77) 20.1 (0.61)
2012 26.4 (0.72) 33.0 (0.72) 19.6 (0.62)
2013 26.5 (0.71) 31.3 (0.79) 19.8 (0.61)
2014 20.0 (0.65)
26.9 (0.73) 14.2 (0.56)
1
A person was defined as uninsured if he or she did not have any private health insurance, Medicare, Medicaid, Children’s Health Insurance Program (CHIP), state-sponsored or other
government-sponsored health plan, or military plan. A person was also defined as uninsured if he or she had only Indian Health Service coverage or had only a private plan that paid
for one type of service, such as accidents or dental care.
2
In references to “part of the past year” and “more than a year,” a year is defined as the 12 months prior to interview.
NOTE: Data are based on household interviews of a sample of the civilian noninstitutionalized population.
DATA SOURCE: CDC/NCHS, National Health Interview Survey, 2009–2 01 4, Family Core component.
Page | 8 U.S. Department of Health and Human Services ● Centers for Disease Control and Prevention ● National Center for Health Statistics ● Released 6/15

Health Insurance Coverage: Early Release of Estimates From the National Health Interview Survey, 2014
Table 2. Numbers of persons who lacked health insurance coverage at the time of interview, for at least part of the past year, and for
more than a year, by age group and year: United States, 2014
Age group and year
Uninsured
1
at
the time of interview
Uninsured
1
for at least
part of the past year
2
Uninsured
1
for
more than a year
2
Number (millions)
All ages
2009 46.3 58.5 32.8
2010
48.6 60.3 35.7
2011
46.3 58.7 34.2
2012 45.5 57.5 34.1
2013 44.8 55.4 33.4
2014 36.0 51.6 26.3
Under 65 years
2009 46.0 57.9 32.6
2010
48.2 59.6 35.4
2011
45.9 58.0 33.9
2012 45.2 56.8 33.9
2013 44.3 54.7 33.1
2014 35.7 50.8 26.1
0–17 years
2009 6.1 9.5 3.6
2010
5.8 8.7 3.4
2011 5.2 8.1 2.7
2012 4.9 7.7 2.7
2013 4.8 7.3 2.6
2014 4.0 6.9 2.2
18–64 years
2009 40.0 48.4 29.1
2010 42.5 51.0 32.0
2011 40.7 49.9 31.2
2012 40.3 49.2 31.2
2013 39.6 47.4 30.5
2014 31.7 44.0 23.9
19–25 years
2009
9.5 11.6 6.4
2010
10.0 12.3 7.1
2011 8.4 10.8 6.0
2012 7.9 9.9 5.9
2013 8.0 9.5 6.0
2014 6.0
8.1 4.3
1
A person was defined as uninsured if he or she did not have any private health insurance, Medicare, Medicaid, Children’s Health Insurance Program (CHIP), state-sponsored or other
government-sponsored health plan, or military plan. A person was also defined as uninsured if he or she had only Indian Health Service coverage or had only a private plan that paid
for one type of service, such as accidents or dental care.
2
In references to “part of the past year” and “more than a year,” a year is defined as the 12 months prior to interview.
NOTE: Data are based on household interviews of a sample of the civilian noninstitutionalized population.
DATA SOURCE: CDC/NCHS, National Health Interview Survey, 2009–201 4, Family Core component.
Page | 9 U.S. Department of Health and Human Services ● Centers for Disease Control and Prevention ● National Center for Health Statistics ● Released 6/15

Health Insurance Coverage: Early Release of Estimates From the National Health Interview Survey, 2014
Table 3. Percentages of persons who lacked health insurance coverage, had public health plan coverage, and had private health
insurance coverage at the time of interview, by age group and selected years: United States, 1997–2014
Age group and year
Uninsured
1
at the time of
interview Public health plan coverage
2
Private health insurance
coverage
3
Percent (standard error)
All ages
1997 15.4 (0.21) 23.3 (0.27) 70.7 (0.32)
2005 14.2 (0.21) 26.4 (0.30) 67.3 (0.37)
2009 15.4 (0.30) 30.4 (0.40) 61.9 (0.50)
2010 16.0 (0.27) 31.4 (0.39) 60.2 (0.48)
2011 15.1 (0.25) 32.4 (0.37) 60.1 (0.48)
2012 14.7 (0.23) 33.4 (0.35) 59.6 (0.43)
2013 14.4 (0.26) 33.8 (0.36) 59.5 (0.49)
2014 11.5 (0.23) 34.6 (0.37) 61.8 (0.45)
Under 65 years
1997 17.4 (0.24) 13.6 (0.25) 70.8 (0.35)
2005 16.0 (0.24) 16.8 (0.29) 68.4 (0.39)
2009 17.5 (0.34) 21.0 (0.39) 62.9 (0.54)
2010 18.2 (0.30) 22.0 (0.38) 61.2 (0.50)
2011 17.3 (0.29) 23.0 (0.37) 61.2 (0.51)
2012 16.9 (0.27) 23.5 (0.37) 61.0 (0.47)
2013 16.6 (0.30) 23.8 (0.35) 61.0 (0.52)
2014 13.3 (0.26) 24.5 (0.36) 63.6 (0.46)
0–17 years
1997 13.9 (0.36) 21.4 (0.48) 66.2 (0.57)
2005 8.9 (0.29) 29.9 (0.56) 62.4 (0.60)
2009 8.2 (0.40) 37.7 (0.76) 55.7 (0.86)
2010 7.8 (0.32) 39.8 (0.73) 53.8 (0.75)
2011 7.0 (0.27) 41.0 (0.74) 53.3 (0.76)
2012 6.6 (0.27) 42.1 (0.72) 52.8 (0.73)
2013 6.5 (0.26) 42.2 (0.70) 52.6 (0.76)
2014 5.5 (0.27) 42.2 (0.65) 53.7 (0.68)
18–64 years
1997 18.9 (0.23) 10.2 (0.20) 72.8 (0.30)
2005 18.9 (0.26) 11.5 (0.22) 70.9 (0.36)
2009 21.1 (0.37) 14.4 (0.31) 65.8 (0.47)
2010 22.3 (0.35) 15.0 (0.30) 64.1 (0.46)
2011 21.3 (0.34) 15.9 (0.29) 64.2 (0.45)
2012 20.9 (0.31) 16.4 (0.29) 64.1 (0.42)
2013 20.4 (0.37)
16.7 (0.30) 64.2 (0.47)
2014 16.3 (0.31) 17.7 (0.32) 67.3 (0.43)
See footnotes at end of table.
Page | 10 U.S. Department of Health and Human Services ● Centers for Disease Control and Prevention ● National Center for Health Statistics ● Released 6/15

Health Insurance Coverage: Early Release of Estimates From the National Health Interview Survey, 2014
Table 3. Percentages of persons who lacked health insurance coverage, had public health plan coverage, and had private health
insurance coverage at the time of interview, by age group and selected years: United States, 1997–2014—Continued
Age group and year
Uninsured
1
at the time of
interview Public health plan coverage
2
Private health insurance
coverage
3
Percent (standard error)
19–25 years
1997 31.4 (0.63) 11.2 (0.46) 58.4 (0.71)
2005 31.2 (0.65) 12.9 (0.51) 56.5 (0.79)
2009 32.7 (0.82) 15.0 (0.62) 52.6 (0.91)
2010 33.9 (0.73) 15.7 (0.55) 51.0 (0.84)
2011 27.9 (0.71) 16.8 (0.60) 56.2 (0.85)
2012 26.4 (0.72) 17.5 (0.59) 57.2 (0.85)
2013 26.5 (0.71) 16.1 (0.54) 58.1 (0.84)
2014 20.0 (0.65) 19.1 (0.64) 61.9 (0.88)
1
A person was defined as uninsured if he or she did not have any private health insurance, Medicare, Medicaid, Children’s Health Insurance Program (CHIP), state-sponsored or other
government-sponsored health plan, or military plan. A person was also defined as uninsured if he or she had only Indian Health Service coverage or had only a private plan that paid
for one type of service, such as accidents or dental care.
2
Includes Medicaid, Children’s Health Insurance Program (CHIP), state-sponsored or other government-sponsored health plan, Medicare , and military plans. A sm all number of
persons were covered by both public and private plans and were included in both categories.
3
Includes any comprehensive private insurance plan (including health maintenance and preferred provider organizations). These plans include those obtained through an employer,
purchased directly, purchased through local or community programs, or purchased through the Health Insurance Marketplace or a state-based exchange. Private coverage excludes
plans that pay for only one type of service, s uch as accidents or dental care. A small number of persons were covered by both public and private plans and were included in both
categories.
NOTE: Data are based on household interviews of a sample of the civilian noninstitutionalized population.
DATA SOURCE: CDC/NCHS, National Health Interview Survey, 1 997, 2005, and 2 00 9–2014, Fam ily Core component.
Page | 11 U.S. Department of Health and Human Services ● Centers for Disease Control and Prevention ● National Center for Health Statistics ● Released 6/15

Health Insurance Coverage: Early Release of Estimates From the National Health Interview Survey, 2014
Table 4. Percentages of persons under age 65 who lacked health insurance coverage, had public health plan coverage, and had
private health insurance coverage at the time of interview, by poverty status and year: United States, 2009–2014
Poverty status
1
and year
Uninsured
2
at the time of
interview Public health plan coverage
3
Private health insurance
coverage
4
Percent (standard error)
Poor (<100% FPL)
2009 30.2 (0.89) 56.7 (1.06) 14.1 (0.87)
2010 29.5 (0.83) 56.0 (0.98) 15.5 (0.70)
2011 28.2 (0.66) 56.2 (0.82) 16.6 (0.77)
2012 28.3 (0.65) 57.1 (0.83) 16.1 (0.83)
2013 27.3 (0.68) 59.0 (0.81) 14.7 (0.72)
2014 22.3 (0.66) 62.1 (0.80) 16.6 (0.69)
Near-poor (≥100% and <200% FPL)
2009 29.4 (0.77) 36.7 (0.85) 35.9 (0.93)
2010 32.3 (0.69) 36.2 (0.63) 33.2 (0.77)
2011 30.4 (0.58) 37.7 (0.73) 33.5 (0.75)
2012 29.5 (0.56) 37.1 (0.66) 35.2 (0.75)
2013 29.3 (0.70) 39.1 (0.77) 33.4 (0.79)
2014 23.5 (0.60) 41.1 (0.74) 37.3 (0.81)
Not-poor (≥200% FPL)
2009 10.7 (0.29) 9.0 (0.30) 81.6 (0.42)
2010 10.7 (0.24) 9.7 (0.28) 81.0 (0.36)
2011 10.1 (0.25) 9.9 (0.26) 81.4 (0.36)
2012 9.8 (0.23) 10.3 (0.33) 81.3 (0.39)
2013 9.6 (0.24) 10.5 (0.29) 81.2 (0.39)
2014 7.6 (0.20) 9.9 (0.28) 83.7 (0.36)
Unknown
2009 22.3 (0.85) 20.8 (0.88) 57.9 (1.24)
2010 22.7 (0.95) 21.0 (0.69) 57.3 (1.08)
2011 21.0 (0.64) 26.2 (0.95) 53.9 (1.09)
2012 20.4 (0.73) 28.8 (0.89) 52.1 (1.00)
2013 20.5 (0.76) 24.2 (0.94) 56.8 (1.24)
2014 15.0 (0.80) 22.2 (0.91) 64.1 (1.24)
1
FPL is federal poverty level. Based on family income and family size, using the U.S. Census Bureau’s poverty thresholds. “Poor” persons are defined as those with incomes belo w th e
poverty threshold; “Near-poor” persons have incomes of 100% to less than 200% of the poverty threshold; and “Not-poor” persons have incomes of 200% of the poverty threshold or
greater. For more information on the “Unknown” poverty status category, see Technical Notes. Es timates may differ f rom e stimate s that are bas ed on both reported and imputed
income.
2
A person was defined as uninsured if he or she did not have any private health insurance, Medicare, Medicaid, Children’s Health Insurance Program (CHIP), state-sponsored or other
government-sponsored health plan, or military plan at the time of interview. A person was also defined as uninsured if he or she had only Indian Health Service coverage or had only
a private plan that paid for one type of service, such as accidents or dental care.
3
Includes Medicaid, Children’s Health Insurance Program (CHIP), state-sponsored or other government-sponsored health plan, Medicare , and military plans. A sm all number of
persons were covered by both public and private plans and were included in both categorie s.
4
Includes any comprehensive private insurance plan (including health maintenance and preferred provider organizations). These plans include those obtained through an employer,
purchased directly, purchased through local or community programs, or p u r chased through the Health Insurance Marketplace or a state-based exchange. Private coverage excludes
plans that pay for only one type of service, s uch as accidents or dental care. A small number of persons were covered by both public and private plans and were included in both
categories.
NOTE: Data are based on household interviews of a sample of the civilian noninstitutionalized population.
DATA SOURCE: CDC/NCHS, National Health Interview Survey, 2009–2 01 4, Family Core component.
Page | 12 U.S. Department of Health and Human Services ● Centers for Disease Control and Prevention ● National Center for Health Statistics ● Released 6/15

Health Insurance Coverage: Early Release of Estimates From the National Health Interview Survey, 2014
Table 5. Percentages of adults aged 18–64 who lacked health insurance coverage, had public health plan coverage, and had private
health insurance coverage at the time of interview, by poverty status and year: United States, 2009–2014
Poverty status
1
and year
Uninsured
2
at the time of
interview Public health plan coverage
3
Private health insurance
coverage
4
Percent (standard error)
Poor (<100% FPL)
2009 42.5 (1.20) 40.3 (1.21) 18.0 (1.15)
2010 42.2 (0.99) 38.8 (0.97) 19.6 (0.89)
2011 40.1 (0.92) 39.6 (0.93) 21.2 (1.02)
2012 40.1 (0.90) 40.8 (0.94) 20.2 (1.09)
2013 39.3 (1.00) 42.4 (0.95) 19.0 (0.97)
2014 32.3 (0.93) 46.6 (0.95) 21.9 (0.92)
Near-poor (≥100% and <200% FPL)
2009 39.1 (0.85) 24.5 (0.75) 37.7 (0.84)
2010 43.0 (0.74) 23.7 (0.55) 34.7 (0.74)
2011 40.1 (0.72) 25.9 (0.69) 35.4 (0.75)
2012 39.2 (0.68) 25.2 (0.57) 37.2 (0.74)
2013 38.5 (0.84) 26.6 (0.78) 36.4 (0.78)
2014 30.9 (0.72) 29.6 (0.76) 41.2 (0.81)
Not-poor (≥200% FPL)
2009 12.5 (0.31) 7.6 (0.26) 81.4 (0.38)
2010 12.6 (0.27) 8.1 (0.27) 80.8 (0.36)
2011 12.0 (0.28) 8.3 (0.23) 81.1 (0.35)
2012 11.4 (0.26) 8.7 (0.29) 81.3 (0.38)
2013 11.4 (0.27) 8.9 (0.26) 81.2 (0.37)
2014 8.9 (0.23) 8.5 (0.26) 83.9 (0.35)
Unknown
2009 26.7 (0.99) 15.5 (0.69) 58.8 (1.13)
2010 27.1 (1.10) 15.6 (0.63) 58.4 (1.11)
2011 25.6 (0.77) 17.6 (0.73) 58.1 (0.96)
2012 25.7 (0.88) 18.9 (0.76) 56.9 (0.92)
2013 24.3 (0.87) 17.6 (0.77) 59.5 (1.11)
2014 17.2 (0.88) 17.2 (0.81) 67.0 (1.20)
1
FPL is federal poverty level. Based on family income and family size, using the U.S. Census Bureau’s poverty thresholds. “Poor” persons are defined as those with incomes belo w th e
poverty threshold; “Near-poor” persons have incomes of 100% to less than 200% of the poverty threshold; and “Not-poor” persons have incomes of 200% of the poverty threshold or
greater. For more information on the “Unknown” poverty status category, see Technical Notes. Es timates may differ f rom e stimate s that are bas ed on both reported and imputed
income.
2
A person was defined as uninsured if he or she did not have any private health insurance, Medicare, Medicaid, Children’s Health Insurance Program (CHIP), state-sponsored or other
government-sponsored health plan, or military plan at the time of interview. A person was also defined as uninsured if he or she had only Indian Health Service coverage or had only
a private plan that paid for one type of service, such as accidents or dental care.
3
Includes Medicaid, Children’s Health Insurance Pro gram ( CHIP) , s t ate-sponsored or other government-sponsored health plan, Medicare, and military plans . A sm all number of
persons were covered by both public and private plans and were included in both categories.
4
Includes any comprehensive private insurance plan (including health maintenance and preferred provider organizations). These plans include those obtained through an employer,
purchased directly, purchased through local or community programs, or purchased through the Health Insurance Marketplace or a state-based exchange. Private coverage excludes
plans that pay for only one type of service, s uch as accidents or dental care. A small number of persons were covered by both public and private plans and were included in both
categories.
NOTE: Data are based on household interviews of a sample of the civilian noninstitutionalized population.
DATA SOURCE: CDC/NCHS, National Health Interview Survey, 2 00 9–2 01 4, Family Core component.
Page | 13 U.S. Department of Health and Human Services ● Centers for Disease Control and Prevention ● National Center for Health Statistics ● Released 6/15

Health Insurance Coverage: Early Release of Estimates From the National Health Interview Survey, 2014
Table 6. Percentages of children aged 0–17 who lacked health insurance coverage, had public health plan coverage, and had private
health insurance coverage at the time of interview, by poverty status and year: United States, 2009–2014
Poverty status
1
and year
Uninsured
2
at the time of
interview Public health plan coverage
3
Private health insurance
coverage
4
Percent (standard error)
Poor (<100% FPL)
2009 11.8 (0.94) 81.4 (1.11) 8.2 (0.81)
2010 10.2 (0.96) 82.0 (1.22) 9.2 (0.70)
2011 8.1 (0.62) 84.4 (0.87) 8.9 (0.72)
2012 7.5 (0.58) 85.9 (0.80) 8.8 (0.78)
2013 7.8 (0.62) 86.1 (0.88) 7.7 (0.69)
2014 5.9 (0.52) 87.3 (0.72) 8.0 (0.62)
Near-poor (≥100% and <200% FPL)
2009 12.1 (0.90) 58.4 (1.42) 32.8 (1.43)
2010 12.6 (0.73) 59.2 (1.16) 30.5 (1.18)
2011 11.5 (0.69) 60.8 (1.17) 29.9 (1.07)
2012 10.1 (0.70) 61.0 (1.30) 31.1 (1.18)
2013 10.6 (0.72) 64.4 (1.16) 27.3 (1.17)
2014 8.6 (0.65) 64.3 (1.23) 29.4 (1.19)
Not-poor (≥200% FPL)
2009 5.0 (0.39) 13.7 (0.63) 82.4 (0.73)
2010 4.6 (0.29) 14.9 (0.57) 81.4 (0.61)
2011 4.0 (0.27) 15.0 (0.55) 82.1 (0.58)
2012 4.5 (0.31) 15.2 (0.62) 81.3 (0.64)
2013 4.0 (0.28) 15.6 (0.62) 81.2 (0.65)
2014 3.6 (0.28) 14.4 (0.56) 83.1 (0.58)
Unknown
2009 9.8 (0.99) 36.1 (2.05) 55.3 (2.07)
2010 8.8 (0.89) 38.1 (1.71) 53.7 (1.74)
2011 10.4 (0.76) 45.9 (1.70) 44.5 (1.66)
2012 8.2 (0.77) 51.8 (1.50) 41.2 (1.49)
2013 9.2 (1.00) 43.7 (2.16) 48.6 (2.20)
2014 8.0 (1.41) 37.9 (2.01) 54.8 (2.05)
1
FPL is federal poverty level. Based on family income and f amily s ize, using the U.S. Census Bure au’s poverty thres holds . “Poor” persons are define d as those with incomes belo w th e
poverty threshold; “Near-poor” persons have incomes of 100% to less than 200% of the poverty threshold; and “Not-poor” persons have incomes of 200% of the poverty threshold or
greater. For more information on the “Unknown” poverty status category, see Technical Notes. Es timates may differ from estimates that are based on both reported and imputed
income.
2
A person was defined as uninsured if he or she did not have any private health insurance, Medicare, Medicaid, Children’s Health Insurance Program (CHIP), state-sponsored or other
government-sponsored health plan, or military plan at the time of interview. A person was also defined as uninsured if he or she had only Indian Health Service coverage or had only
a private plan that paid for one type of service, such as accidents or dental care.
3
Includes Medicaid, Children’s Health Insurance Program (CHIP), state-sponsored or other government-sponsored health plan, Medicare, and military plans . A sm all number of
persons were covered by both public and private plans and were included in both categories.
4
Includes any comprehensive private insurance plan (including health maintenance and preferred provider organizations). These plans include those obtained through an employer,
purchased directly, purchased through local or community programs, or purchased through the Health Insurance Marketplace or a state-based exchange. Private coverage excludes
plans that pay for only one type of service, s uch as accidents or dental care. A small number of persons were covered by both public and private plans and were included in both
categories.
NOTE: Data are based on household interviews of a sample of the civilian noninstitutionalized population.
DATA SOURCE: CDC/NCHS, National Health Interview Survey, 2009–2 01 4, Family Core component.
Page | 14 U.S. Department of Health and Human Services ● Centers for Disease Control and Prevention ● National Center for Health Statistics ● Released 6/15

Health Insurance Coverage: Early Release of Estimates From the National Health Interview Survey, 2014
Table 7. Percentages of persons who lacked health insurance coverage, had public health plan coverage, and had private health
insurance coverage at the time of interview, by age group and sex: United States, 2014
Age group and sex
Uninsured
1
at the time of
interview Public health plan coverage
2
Private health insurance
coverage
3
Percent (standard error)
Age group (years)
All ages 11.5 (0.23) 34.6 (0.37) 61.8 (0.45)
Under 65 13.3 (0.26) 24.5 (0.36) 63.6 (0.46)
0–17 5.5 (0.27) 42.2 (0.65) 53.7 (0.68)
18–64 16.3 (0.31) 17.7 (0.32) 67.3 (0.43)
18–24 18.3 (0.61) 20.9 (0.67) 61.8 (0.84)
25–34 22.6 (0.52) 16.3 (0.49) 61.9 (0.64)
35–44 17.6 (0.51) 14.4 (0.42) 68.5 (0.64)
45–64 11.7 (0.31) 18.9 (0.42) 71.5 (0.50)
65 and over 0.8 (0.09) 95.0 (0.24) 51.2 (0.84)
19–25 20.0 (0.65) 19.1 (0.64) 61.9 (0.88)
Sex
Male:
All ages 12.9 (0.28) 32.2 (0.40) 62.1 (0.48)
Under 65 14.7 (0.31) 22.8 (0.39) 63.8 (0.50)
0–17 5.6 (0.33) 42.0 (0.75) 53.8 (0.76)
18–64 18.3 (0.38) 15.2 (0.36) 67.7 (0.47)
18–24 21.2 (0.90) 17.2 (0.83) 62.4 (1.14)
25–34 26.3 (0.73) 11.4 (0.52) 63.0 (0.77)
35–44 19.9 (0.68) 11.5 (0.54) 69.1 (0.79)
45–64 12.4 (0.39) 18.3 (0.52) 71.4 (0.59)
65 and over 0.8 (0.13) 94.4 (0.31) 51.0 (0.94)
19–25 23.1 (0.93) 14.8 (0.77) 62.8 (1.10)
Female:
All ages 10.2 (0.22) 37.0 (0.39) 61.5 (0.47)
Under 65 11.9 (0.26) 26.1 (0.39) 63.4 (0.49)
0–17 5.3 (0.30) 42.5 (0.72) 53.6 (0.77)
18–64 14.3 (0.30) 20.1 (0.36) 66.9 (0.46)
18–24 15.4 (0.66) 24.7 (0.91) 61.1 (1.09)
25–34 19.0 (0.59) 21.0 (0.68) 60.8 (0.74)
35–44 15.4 (0.51) 17.2 (0.51) 67.9 (0.68)
45–64 11.1 (0.34) 19.4 (0.45) 71.6 (0.54)
65 and over 0.8 (0.09) 95.5 (0.29) 51.4 (0.89)
19–25 16.9 (0.70)
23.4 (0.88) 60.9 (1.08)
1
A person was defined as uninsured if he or she did not have any private health insurance, Medicare, Medicaid, Children’s Health Insurance Program (CHIP), state-sponsored or other
government-sponsored health plan, or military plan at the time of interview. A person was also defined as uninsured if he or she had only Indian Health Service coverage or had only
a private plan that paid for one type of service, such as accidents or dental care.
2
Includes Medicaid, Children’s Health Insurance Program (CHIP), state-sponsored or other government-sponsored health plan, Medicare, and military plans . A sm all number of
persons were covered by both public and private plans and were included in both categories.
3
Includes any comprehensive private insurance plan (including health maintenance and preferred provider organizations). These plans include those obtained through an employer,
purchased directly, purchased through local or community programs, or purchased through the Health Insurance Marketplace or a state-based exchange. Private coverage excludes
plans that pay for only one type of service, s uch as accidents or dental care. A small number of persons were covered by both public and private plans and were included in both
categories.
NOTE: Data are based on household interviews of a sample of the civilian noninstitutionalized population.
DATA SOURCE: CDC/NCHS, National Health Interview Survey, 2 01 4, Family Core component.
Page | 15 U.S. Department of Health and Human Services ● Centers for Disease Control and Prevention ● National Center for Health Statistics ● Released 6/15

Health Insurance Coverage: Early Release of Estimates From the National Health Interview Survey, 2014
Table 8. Percentages of persons under age 65 who lacked health insurance coverage, had public health plan coverage, and had
private health insurance coverage at the time of interview, by race/ethnicity and year: United States, 2009–2014
Race/ethnicity and year
Uninsured
1
at the time of
interview
Public health plan
coverage
2
Private health insurance
coverage
3
Percent (standard error)
Hispanic or Latino
2009 32.8 (0.86) 30.6 (0.78) 37.1 (0.89)
2010 31.9 (0.72) 32.0 (0.78) 36.6 (0.81)
2011 31.1 (0.68) 33.6 (0.74) 36.1 (0.82)
2012 30.4 (0.71) 34.0 (0.71) 36.4 (0.74)
2013 30.3 (0.66) 33.4 (0.62) 37.0 (0.76)
2014 25.2 (0.59) 34.6 (0.78) 41.2 (0.89)
Non-Hispanic white, single race
2009 13.1 (0.34) 15.6 (0.42) 72.9 (0.57)
2010 13.7 (0.30) 16.4 (0.42) 71.4 (0.57)
2011 13.0 (0.32) 17.1 (0.39) 71.4 (0.55)
2012 12.7 (0.28) 17.3 (0.39) 71.5 (0.51)
2013 12.1 (0.29) 17.9 (0.38) 71.6 (0.53)
2014 9.8 (0.25) 18.1 (0.41) 73.6 (0.50)
Non-Hispanic black, single race
2009 18.8 (0.59) 34.9 (0.97) 47.8 (0.99)
2010 20.8 (0.63) 36.3 (0.79) 44.6 (0.84)
2011 19.0 (0.51) 36.9 (0.83) 45.6 (0.85)
2012 17.9 (0.50) 38.2 (0.77) 45.4 (0.79)
2013 18.9 (0.51) 37.5 (0.92) 44.9 (1.01)
2014 13.5 (0.49) 40.3 (0.76) 47.7 (0.86)
Non-Hispanic Asian, single race
2009 15.2 (0.93) 13.0 (1.00) 72.5 (1.36)
2010 16.8 (0.76) 14.9 (0.98) 69.1 (1.17)
2011 16.0 (0.89) 17.6 (1.14) 67.0 (1.40)
2012 16.4 (0.93) 16.6 (0.85) 67.5 (1.24)
2013 13.8 (0.81) 17.5 (1.00) 69.4 (1.27)
2014 10.6 (0.61) 16.7 (0.86) 73.4 (1.01)
Non-Hispanic other races and multiple races
2009 19.9 (1.50) 34.6 (1.96) 48.2 (2.59)
2010 22.4 (4.83) 30.3 (2.14) 48.7 (3.83)
2011 19.1 (1.78) 32.5 (1.60) 50.6 (1.89)
2012 16.4 (1.33) 35.8 (1.77) 50.8 (2.16)
2013 16.0 (1.17) 35.9 (1.75) 50.1 (1.97)
2014 12.8 (1.30)
36.2 (1.69) 52.7 (2.01)
1
A person was defined as uninsured if he or she did not have any private health insurance, Medicare, Medicaid, Children’s Health Insurance Program (CHIP), state-sponsored or other
government-sponsored health plan, or military plan. A person was also defined as uninsured if he or she had only Indian Health Service coverage or had only a private plan that paid
for one type of service, such as accidents or dental care.
2
Includes Medicaid, Children’s Health Insurance Program (CHIP), state-sponsored or other government-sponsored health plan, Medicare, and military plans. A sm all number of
persons were covered by both public and private plans and were included in both categories.
3
Includes any comprehensive private insurance plan (including health maintenance and preferred provider organizations). These plans include those obtained through an employer,
purchased directly, purchased through local or community programs, or purchased through the Health Insurance Marketplace or a state-based exchange. Private coverage excludes
plans that pay for only one type of s ervice , such as accidents or dental care. A small numbe r of persons were covered by both public and private plans and were included in both
categories.
NOTE: Data are based on household interviews of a sample of the civilian noninstitutionalized population.
DATA SOURCE: CDC/NCHS, National Health Interview Survey, 2009–2 01 4, Family Core component.
Page | 16 U.S. Department of Health and Human Services ● Centers for Disease Control and Prevention ● National Center for Health Statistics ● Released 6/15

Health Insurance Coverage: Early Release of Estimates From the National Health Interview Survey, 2014
Table 9. Percentages of adults aged 18–64 who lacked health insurance coverage, had public health plan coverage, and had private
health insurance coverage at the time of interview, by selected demographic characteristics: United States, 2014
Selected characteristic
Uninsured
1
at the time of
interview
Public health plan
coverage
2
Private health insurance
coverage
3
Percent (standard error)
Race/ethnicity
Hispanic or Latino 33.7 (0.76) 20.6 (0.73) 46.4 (0.86)
Non-Hispanic:
White, single race 11.6 (0.29) 14.6 (0.36) 75.3 (0.47)
Black, single race 17.7 (0.60) 30.5 (0.73) 53.4 (0.84)
Asian, single race 12.5 (0.65) 13.7 (0.84) 74.5 (1.01)
Other races and multiple races 19.5 (1.65) 25.2 (1.51) 56.9 (2.06)
Region
Northeast 11.2 (0.45) 19.2 (0.83) 70.9 (0.85)
Midwest 12.9 (0.48) 16.5 (0.66) 71.9 (0.84)
South 20.7 (0.62) 17.1 (0.49) 63.7 (0.75)
West 16.3 (0.56) 18.9 (0.69) 66.0 (0.89)
Education
Less than high school 34.0 (0.88) 34.0 (0.87) 33.3 (0.85)
High school diploma or GED
4
22.2 (0.50) 23.0 (0.53) 56.2 (0.63)
More than high school 10.0 (0.25) 12.2 (0.29) 79.1 (0.39)
Employment status
Employed 14.9 (0.32) 9.5 (0.24) 76.2 (0.39)
Unemployed 38.7 (1.07) 32.3 (1.13) 29.6 (1.01)
Not in workforce 15.4 (0.46) 41.0 (0.66) 47.1 (0.68)
Poverty status
5
<100% FPL 32.3 (0.93) 46.6 (0.95) 21.9 (0.92)
≥100% and ≤138% FPL 33.8 (1.07) 37.2 (1.09) 30.3 (1.13)
>138% and ≤250% FPL 25.8 (0.60) 21.1 (0.64) 54.9 (0.75)
>250% and ≤400% FPL 12.6 (0.42) 10.5 (0.43) 78.3 (0.55)
>400% FPL 4.1 (0.20) 5.7 (0.29) 91.3 (0.33)
Unknown 14.8 (0.75) 14.8 (0.71) 71.8 (1.08)
Marital status
Married 12.0 (0.32) 12.9 (0.34) 76.4 (0.45)
Widowed 17.5 (1.59) 33.8 (1.91) 51.2 (2.13)
Divorced or separated 18.6 (0.54) 27.9 (0.82) 55.3 (0.84)
Living with partner 27.7 (0.91) 19.3 (0.75) 54.0 (1.06)
Never married 20.2 (0.46) 22.3 (0.51) 58.6 (0.65)
1
A pers on was defined as uninsured if he or she did not have any private health insurance, Medicare, Medicaid, Children’s Health Insurance Program (CHIP), state-sponsored or other
government-sponsored health plan, or military plan. A person was also defined as uninsured if he or she had only Indian Health Service coverage or had only a private plan that paid
for one type of service, such as accidents or dental care.
2
Includes Medicaid, Children’s Health Insurance Program (CHIP), state-sponsored or other government-sponsored health plan, Medicare, and military plans. A sm all number of
persons were covered by both public and private plans and were included in both categories.
3
Includes any comprehensive private insurance plan (including health maintenance and preferred provider organizations). These plans include those obtained through an employer,
purchased directly, purchased through local or community programs, or purchased through the Health Insurance Marketplace or a state-based exchange. Private coverage excludes
plans that pay for only one type of service, s uch as accidents or dental care. A small numbe r of persons were covered by both public and private plans and were included in both
categories.
4
GED is General Educational Development high school equivalency diploma.
5
FPL is federal poverty level. Based on family income and f amily s ize, using the U.S. Ce nsus Bureau’s poverty thresholds. The percentage of respondents with “Unknown” poverty
status for this five -level categorization is 1 0.0%. This value is greater than the corresponding value for the three-leve l poverty cate gorization because of greater uncertainty whe n
assigning individuals to more detailed poverty groups. For more information on poverty status, see Technical Notes. Estimates may differ from estimates that are based on both
reporte d and imputed income.
NOTE: Data are based on household interviews of a sample of the civilian noninstitutionalized population.
DATA SOURCE: CDC/NCHS, National Health Interview Survey, 2014, Family Core compon e nt .
Page | 17 U.S. Department of Health and Human Services ● Centers for Disease Control and Prevention ● National Center for Health Statistics ● Relea sed 6/15

Health Insurance Coverage: Early Release of Estimates From the National Health Interview Survey, 2014
Table 10. Percentages of persons under age 65 with private health insurance coverage who were enrolled in a high-deductible
health plan, in a high-deductible health plan without a health savings account, and in a consumer-directed health plan, and who
were in a family with a flexible spending account for medical expenses, by year: United States, 2009–2014
Year
Enrolled in high-
deductible health plan
(HDHP)
1
Enrolled in HDHP without
health savings account
(HSA)
2
Enrolled in consumer-
directed health plan
(CDHP)
3
In family with flexible
spending account (FSA)
for medical expenses
Percent (standard error)
2009 22.5 (0.58) 15.9 (0.43) 6.6 (0.33) 20.4 (0.50)
2010 25.3 (0.54) 17.6 (0.46) 7.7 (0.33) 20.4 (0.50)
2011 29.0 (0.54) 19.9 (0.41) 9.2 (0.35) 21.4 (0.53)
2012 31.1 (0.57) 20.3 (0.42) 10.8 (0.34) 21.6 (0.45)
2013 33.9 (0.68) 22.2 (0.48) 11.7 (0.43) 21.6 (0.48)
2014 36.9 (0.77) 23.6 (0.52) 13.3 (0.47) 21.2 (0.49)
1
An HDHP was defined in 2014 as a health plan with an annual deductible of at least $1,250 for se lf-only coverage and $2,500 for family coverage. The deductible is adjusted annually
for inflation. Deductibles for previous years are included in Technical Notes.
2
An HSA is a tax-advantaged account or fund that can be used to pay for medical expenses. It must be coupled with an HDHP.
3
A CDHP is an HDHP coupled with an HSA.
NOTES: The measures of HDHP enrollment, CDHP enrollment, and being in a family with an FSA for medical expenses are not mutually e xclusive. The refore , a person may be counted
in more than one measure. The individual components of HDHPs may not add up to the total due to rounding. Data are based on household interviews of a sample of the civilian
noninstitutionalized population.
DATA SOURCE: CDC/NCHS, National Health Interview Survey, 2009–2 01 4, Family Core component.
Table 11. Percentage of persons under age 65 with private health insurance coverage who were enrolled in a high-deductible health
plan, by year and source of coverage: United States, 2009–2014
Year Employment-based
1
Directly purchased
2
Percent (standard error)
2009 20.2 (0.59) 46.9 (1.84)
2010 23.3 (0.54) 48.0 (1.48)
2011 26.9 (0.53) 52.4 (1.49)
2012 29.2 (0.60) 54.7 (1.61)
2013 32.0 (0.67) 56.4 (1.50)
2014 36.2 (0.73) 54.1 (1.43)
1
Private insurance that was originally obtained through a present or former employer or union, or through a professional association.
2
Private insurance that was originally obtained through direct purchase or other means not related to e mployment.
NOTES: For persons under age 65, approximately 8% of private health plans were directly purchased f rom 2009 through 2 01 3. In 20 14, 1 0% of private plans were directly purchased.
Data are based on household interviews of a sample of the civilian noninstitutionalized population.
DATA SOURCE: CDC/NCHS, National Health Interview Survey, 2009–2 01 4, Family Core component.
Page | 18 U.S. Department of Health and Human Services ● Centers for Disease Control and Prevention ● National Center for Health Statistics ● Released 6/15

Health Insurance Coverage: Early Release of Estimates From the National Health Interview Survey, 2014
Table 12. Percentages of persons under age 65 who lacked health insurance coverage, had public health plan coverage, and had
private health insurance coverage at the time of interview, by age group, state Medicaid expansion status, and year:
United States, 2009–2014
Age group, state Medicaid expansion
status, and year
Uninsured
1
at the time of
interview Public health plan coverage
2
Private health insurance
coverage
3
Percent (standard error)
Under 65 years
Medicaid expansion states
4
2009 15.4 (0.37) 20.7 (0.56) 65.3 (0.73)
2010 16.4 (0.42) 21.8 (0.54) 63.1 (0.70)
2011 15.3 (0.35) 23.1 (0.56) 62.9 (0.72)
2012 15.0 (0.34) 23.1 (0.50) 63.3 (0.63)
2013 14.9 (0.40) 24.1 (0.48) 62.3 (0.68)
2014 10.9 (0.29) 25.6 (0.49) 64.9 (0.59)
Non-Medicaid expansion states
5
2009 20.0 (0.60) 21.3 (0.54) 60.1 (0.80)
2010 20.3 (0.48) 22.1 (0.51) 59.0 (0.76)
2011 19.6 (0.50) 22.7 (0.50) 59.1 (0.78)
2012 19.2 (0.45) 24.0 (0.55) 58.3 (0.75)
2013 18.4 (0.48) 23.4 (0.51) 59.6 (0.80)
2014 16.0 (0.44) 23.2 (0.52) 62.1 (0.76)
0–17 years
Medicaid expansion states
4
2009 5.9 (0.43) 36.3 (1.09) 59.5 (1.15)
2010 6.7 (0.46) 38.2 (1.05) 56.5 (1.06)
2011 5.9 (0.33) 40.2 (1.11) 55.4 (1.09)
2012 5.3 (0.32) 40.4 (1.00) 55.9 (1.07)
2013 5.6 (0.33) 41.3 (0.86) 54.5 (0.95)
2014 4.3 (0.33) 41.0 (0.84) 56.2 (0.88)
Non-Medicaid expansion states
5
2009 10.8 (0.68) 39.4 (1.00) 51.3 (1.20)
2010 9.0 (0.47) 41.7 (0.99) 50.7 (1.08)
2011 8.3 (0.46) 42.0 (1.02) 50.9 (1.11)
2012 8.0 (0.46) 43.9 (1.11) 49.4 (1.07)
2013 7.5 (0.40) 43.1 (1.12) 50.5 (1.23)
2014 6.7 (0.43) 43.5 (1.06) 51.0 (1.11)
18–64 years
Medicaid expansion states
4
2009 19.0 (0.43) 14.7 (0.43) 67.5 (0.63)
2010 20.1 (0.47) 15.5 (0.40) 65.6 (0.62)
2011 18.9 (0.41)
16.6 (0.41) 65.8 (0.61)
2012 18.5 (0.39) 16.7 (0.38) 66.0 (0.53)
2013 18.4 (0.49) 17.7 (0.44) 65.2 (0.65)
2014 13.3 (0.34) 19.9 (0.46) 68.1 (0.56)
Non-Medicaid expansion states
5
2009 23.6 (0.65) 14.2 (0.44) 63.6 (0.71)
2010 24.8 (0.58) 14.4 (0.45) 62.2 (0.70)
2011 24.1 (0.60) 15.1 (0.42) 62.3 (0.71)
2012 23.7 (0.54) 16.1 (0.44) 61.8 (0.69)
2013 22.7 (0.59) 15.6 (0.41) 63.2 (0.69)
2014 19.6 (0.54) 15.3 (0.41) 66.5 (0.69)
1
A person was defined as uninsured if he or she did not have any private health insurance, Medicare, Medicaid, Children’s Health Insurance Program (CHIP), state-sponsored or other
government-sponsored health plan, or military plan. A person was also defined as uninsured if he or she had only Indian Health Service coverage or had only a private plan that paid
for one type of service, such as accidents or dental care.
2
Includes Medicaid, Children’s Health Insurance Program (CHIP), state-sponsored or other government-sponsored health plan, Medicare, and military plans . A sm all number of
persons were covered by both public and private plans and were included in both categories.
3
Includes any comprehensive private insurance plan (including health maintenance and preferred provider organizations). These plans include those obtained through an employer,
purchased directly, purchased through local or community programs, or purchased through the Health Insurance Marketplace or a state-based exchange. Private coverage excludes
plans that pay for only one type of service, s uch as accidents or dental care. A small number of persons were covered by both public and private plans and were included in both
categories.
4
States moving forward with Medicaid expansion include AZ, AR, CA, CO, CT, DE, DC, HI, IL, IA, KY, MD, MA, MI, MN, NV, NJ, NM, NY, ND, OH, OR, RI, VT, WA, and WV (as of Oct o ber 31 ,
2013).
5
States not moving forward with Medicaid expansion include AL, AK, FL, GA, ID, IN, KS, LA, ME, MS, MO, MT, NE, NH, NC, OK, PA, SC, SD, TN, TX, UT, VA, WI, and WY (as of October 31,
2013).
NOTE: Data are based on household interviews of a sample of the civilian noninstitutionalized population.
DATA SOURCE: CDC/NCHS, National Health Interview Survey, 2009–2 01 4, Family Core component.
Page | 19 U.S. Department of Health and Human Services ● Centers for Disease Control and Prevention ● National Center for Health Statistics ● Released 6/15

Health Insurance Coverage: Early Release of Estimates From the National Health Interview Survey, 2014
Table 13. Percentages of persons under age 65 who lacked health insurance coverage, had public health plan coverage, and had
private health insurance coverage at the time of interview, by age group, state Health Insurance Marketplace type, and year:
United States, 2009–2014
Age group, state Health Insurance
Marketplace type, and year
Uninsured
1
at the time of
interview Public health plan coverage
2
Private health insurance
coverage
3
Percent (standard error)
Under 65 years
State-based Marketplace states
4
2009 16.1 (0.52) 20.7 (0.68) 64.3 (0.89)
2010 16.3 (0.46) 21.6 (0.66) 63.2 (0.80)
2011 15.9 (0.46) 23.6 (0.70) 61.8 (0.88)
2012 15.2 (0.43) 24.2 (0.66) 61.8 (0.83)
2013 15.2 (0.48) 25.0 (0.56) 61.0 (0.83)
2014 11.1 (0.38) 26.4 (0.63) 63.7 (0.78)
Partnership Marketplace states
5
2009 14.1 (0.76) 21.1 (1.39) 66.7 (1.98)
2010 14.7 (0.87) 22.5 (1.15) 64.8 (1.73)
2011 14.3 (0.71) 22.7 (1.28) 64.5 (1.72)
2012 14.1 (0.70) 20.8 (1.12) 66.7 (1.53)
2013 14.2 (0.83) 21.8 (1.07) 65.6 (1.42)
2014 10.2 (0.57) 24.4 (1.06) 67.2 (1.28)
Federally Facilitated Marketplace
states
6
2009 19.0 (0.53) 21.2 (0.52) 61.2 (0.74)
2010 20.1 (0.48) 22.1 (0.50) 59.1 (0.70)
2011 18.8 (0.45) 22.6 (0.47) 60.0 (0.71)
2012 18.6 (0.41) 23.6 (0.50) 59.3 (0.67)
2013 17.9 (0.44) 23.3 (0.49) 60.2 (0.74)
2014 15.3 (0.40) 23.3 (0.50) 62.8 (0.69)
0–17 years
State-based Marketplace states
4
2009 6.9 (0.61) 36.5 (1.31) 57.9 (1.31)
2010 6.7 (0.50) 38.0 (1.32) 56.4 (1.31)
2011 6.4 (0.47) 40.9 (1.43) 54.2 (1.39)
2012 5.4 (0.43) 42.2 (1.37) 53.9 (1.46)
2013 5.7 (0.37) 42.8 (1.05) 52.6 (1.18)
2014 4.2 (0.40) 42.0 (1.11) 54.9 (1.13)
Partnership Marketplace states
5
2009 3.1 (0.68) 37.7 (2.78) 62.0 (3.23)
2010 4.1 (0.78) 40.7 (2.21) 57.9 (2.31)
2011 4.2 (0.53) 39.6 (2.44) 58.0 (2.39)
2012 3.6 (0.69)
38.5 (2.20) 59.9 (2.26)
2013 4.2 (0.53) 38.4 (1.95) 59.2 (2.08)
2014 3.2 (0.51) 40.8 (1.88) 58.4 (1.99)
Federally Facilitated Marketplace
states
6
2009 10.0 (0.60) 38.5 (0.95) 53.0 (1.13)
2010 9.2 (0.48) 40.7 (0.91) 51.3 (0.97)
2011 8.0 (0.40) 41.4 (0.93) 51.8 (1.01)
2012 7.9 (0.41) 42.7 (1.00) 50.8 (0.98)
2013 7.5 (0.39) 42.6 (1.02) 51.3 (1.11)
2014 6.6 (0.41) 42.6 (0.94) 52.0 (1.00)
See footnotes at end of table.
Page | 20 U.S. Department of Health and Human Services ● Centers for Disease Control and Prevention ● National Center for Health Statistics ● Released 6/15

Health Insurance Coverage: Early Release of Estimates From the National Health Interview Survey, 2014
Table 13. Percentages of persons under age 65 who lacked health insurance coverage, had public health plan coverage, and had
private health insurance coverage at the time of interview, by age, state Health Insurance Marketplace type, and year:
United States, 2009–2014 —Continued
Age group, state Health Insurance
Marketplace type, and year
Uninsured
1
at the time of
interview Public health plan coverage
2
Private health insurance
coverage
3
Percent (standard error)
18–64 years
State-based Marketplace states
4
2009 19.6 (0.61) 14.6 (0.53) 66.8 (0.82)
2010 19.9 (0.52) 15.3 (0.48) 65.9 (0.68)
2011 19.5 (0.53) 17.1 (0.52) 64.7 (0.75)
2012 18.8 (0.50) 17.7 (0.49) 64.7 (0.69)
2013 18.7 (0.60) 18.4 (0.52) 64.1 (0.80)
2014 13.6 (0.45) 20.6 (0.57) 67.0 (0.75)
Partnership Marketplace states
5
2009 18.5 (0.97) 14.5 (1.04) 68.5 (1.70)
2010 18.9 (1.12) 15.3 (0.90) 67.6 (1.59)
2011 18.4 (0.92) 15.9 (0.87) 67.1 (1.52)
2012 18.1 (0.85) 13.9 (0.79) 69.3 (1.36)
2013 17.9 (0.98) 15.7 (0.91) 68.0 (1.29)
2014 12.8 (0.68) 18.2 (0.98) 70.5 (1.22)
Federally Facilitated Marketplace states
6
2009 22.6 (0.57) 14.3 (0.41) 64.5 (0.65)
2010 24.5 (0.56) 14.7 (0.43) 62.2 (0.66)
2011 23.0 (0.54) 15.1 (0.39) 63.3 (0.64)
2012 22.8 (0.48) 16.1 (0.41) 62.7 (0.61)
2013 22.0 (0.54) 15.9 (0.41) 63.6 (0.64)
2014 18.6 (0.49) 15.8 (0.41) 66.9 (0.63)
1
A person was defined as uninsured if he or she did not have any private health insurance, Medicare, Medicaid, Children’s Health Insurance Program (CHIP), state-sponsored or other
government-sponsored health plan, or military plan. A person was also defined as uninsured if he or she had only Indian Health Service coverage or had only a private plan that paid
for one type of service, such as accidents or dental care.
2
Includes Medicaid, Children’s Health Insurance Program (CHIP), state-sponsored or other government-sponsored health plan, Medicare, and military plans . A sm all number of
persons were covered by both public and private plans and were included in both categories.
3
Includes any comprehensive private insurance plan (including health maintenance and preferred provider organizations). These plans include those obtained through an employer,
purchased directly, purchased through local or community programs, or purchased through the Health Insurance Marketplace or a state-based exchange. Private coverage excludes
plans that pay for only one type of service, such as accidents or dental care. A small numbe r of persons w ere covere d by both public and private plans and w ere included in both
categories.
4
State-based Marketplace states are CA, CO, CT, DC, HI, ID, KY, MD, MA, MN, NV, NM, NY, OR, RI, VT, and WA ( as of October 31, 20 13 ).
5
Partnership Marketplace states are AR, DE, IL, IA, MI, NH, and WV (as of October 31, 2013).
6
Federally Facilitated Marketplace states are AL, AK, AZ, FL, GA, IN, KS, LA, ME, MS, MO, MT, NE, NJ, NC, ND, OH, OK, PA, SC, SD, TN, TX, UT, VA, WI, and WY (as of October 31, 2013).
NOTE: Data are based on household interviews of a sample of the civilian noninstitutionalized population.
DATA SOURCE: CDC/NCHS, National Health Interview Survey, 2 00 9–2 01 4, Family Core component.
Page | 21 U.S. Department of Health and Human Services ● Centers for Disease Control and Prevention ● National Center for Health Statistics ● Released 6/15

Health Insurance Coverage: Early Release of Estimates From the National Health Interview Survey, 2014
Table 14. Percentages of persons who lacked health insurance coverage, had public health plan coverage, and had private health
insurance coverage at the time of interview, by age group and expanded region: United States, 2014
Age group and expanded region
1
Uninsured
2
at the time of
interview
Public health plan
coverage
3
Private health insurance
coverage
4
Percent (standard error)
All ages
All states 11.5 (0.23) 34.6 (0.37) 61.8 (0.45)
New England 5.3 (0.57) 36.3 (1.64) 68.5 (1.75)
Middle Atlantic 8.6 (0.41) 35.2 (0.83) 65.3 (0.88)
East North Central 9.0 (0.46) 35.0 (0.91) 66.6 (1.11)
West North Central 8.8 (0.53) 30.0 (1.18) 71.0 (1.03)
South Atlantic 14.0 (0.65) 37.0 (0.89) 56.2 (1.16)
East South Central 11.2 (0.79) 39.3 (2.01) 58.3 (1.97)
West South Central 18.0 (0.69) 31.0 (1.09) 56.6 (1.32)
Mountain 12.6 (0.85) 32.5 (1.69) 62.3 (2.12)
Pacific 11.3 (0.50) 35.0 (0.88) 59.0 (1.10)
Under 65 years
All states 13.3 (0.26) 24.5 (0.36) 63.6 (0.46)
New England 6.3 (0.65) 24.5 (1.79) 70.4 (1.86)
Middle Atlantic 10.1 (0.45) 24.3 (0.77) 66.8 (0.92)
East North Central 10.5 (0.54) 24.3 (0.95) 67.0 (1.19)
West North Central 10.1 (0.60) 19.1 (0.86) 72.4 (1.09)
South Atlantic 16.5 (0.73) 26.0 (0.88) 58.6 (1.28)
East South Central 13.1 (0.95) 29.5 (2.18) 59.6 (2.37)
West South Central 20.3 (0.77) 22.3 (0.89) 58.5 (1.33)
Mountain 14.5 (1.00) 22.4 (1.60) 64.6 (2.09)
Pacific 12.7 (0.57) 26.4 (0.90) 61.9 (1.13)
0–17 years
All states 5.5 (0.27) 42.2 (0.65) 53.7 (0.68)
New England 2.4 (0.64) 35.9 (3.16) 63.2 (3.03)
Middle Atlantic 3.7 (0.68) 40.9 (1.65) 56.4 (1.69)
East North Central 3.5 (0.53) 41.1 (1.52) 57.9 (1.67)
West North Central 3.7 (0.57) 34.8 (1.71) 64.3 (1.74)
South Atlantic 5.5 (0.78) 48.6 (1.60) 46.2 (1.81)
East South Central 5.1 (0.80) 48.6 (3.24) 47.8 (3.16)
West South Central 10.5 (0.76) 42.5 (1.91) 48.2 (1.96)
Mountain 7.9 (0.79) 35.6 (2.88) 58.4 (2.79)
Pacific 4.8 (0.64) 43.3 (1.57) 52.7 (1.67)
See footnotes at end of table.
Page | 22 U.S. Department of Health and Human Services ● Centers for Disease Control and Prevention ● National Center for Health Statistics ● Released 6/15

Health Insurance Coverage: Early Release of Estimates From the National Health Interview Survey, 2014
Table 14. Percentages of persons who lacked health insurance coverage, had public health plan coverage, and had private health
insurance coverage at the time of interview, by age group and expanded region: United States, 2014—Continued
Age group and expanded region
1
Uninsured
2
at the time of
interview
Public health plan
coverage
3
Private health insurance
coverage
4
Percent (standard error)
18–64 years
All states 16.3 (0.31) 17.7 (0.32) 67.3 (0.43)
New England 7.6 (0.80) 20.9 (1.63) 72.7 (1.69)
Middle Atlantic 12.3 (0.54) 18.7 (0.91) 70.4 (0.94)
East North Central 13.1 (0.65) 18.0 (0.84) 70.4 (1.13)
West North Central 12.6 (0.80) 13.1 (0.80) 75.5 (1.12)
South Atlantic 20.6 (0.90) 17.5 (0.79) 63.2 (1.15)
East South Central 16.1 (1.17) 22.3 (1.85) 64.0 (2.15)
West South Central 24.4 (1.03) 13.7 (0.67) 62.9 (1.20)
Mountain 17.5 (1.33) 16.3 (1.23) 67.5 (1.92)
Pacific 15.8 (0.64) 19.9 (0.78) 65.4 (1.04)
1
The New England re gio n includes CT, ME, MA, NH, RI, and VT. The Middle Atlantic region includes DE, DC, MD, NJ, NY, and PA. The East North Central region includes IL, IN, MI, OH, and
WI. The West North Central region includes IA, KS, MN, MO, NE, ND, and SD. The South Atlantic region includes FL, GA, NC, SC, VA, and WV. The East South Central region include s AL, K Y,
MS, and TN. The West South Central region includes AR, LA, OK, and TX. The Mo un tain region includes AZ, CO, ID, MT, NV, NM, UT, and WY. The Pacific region includes AK, CA, HI, OR,
and WA.
2
A person was defined as uninsured if he or she did not have any private health insurance, Medicare, Medicaid, Children’s Health Insurance Program (CHIP), state-sponsored or other
government-sponsored health plan, or military plan. A person was also defined as uninsured if he or she had only Indian Health Service coverage or had only a private plan that paid
for one type of service, such as accidents or dental care.
3
Includes Medicaid, Children’s Health Insurance Program (CHIP), state-sponsored or other government-sponsored health plan, Medicare, and military plans. A small number of
persons were covered by both public and private plans and were included in both categories.
4
Includes any comprehensive private insurance plan (including health maintenance and preferred provider organizations). These plans include those obtained through an employer,
purchased directly, purchased through local or community programs, or purchased through the Health Insurance Marketplace or a state-based exchange. Private coverage excludes
plans that pay for only one type of s ervice, s uch as accidents or dental care. A small numbe r of persons were covered by both public and private plans and were included in both
categories.
NOTE: Data are based on household interviews of a sample of the civilian noninstitutionalized population.
DATA SOURCE: CDC/NCHS, National Health Interview Survey, 2014, Family Core component.
Page | 23 U.S. Department of Health and Human Services ● Centers for Disease Control and Prevention ● National Center for Health Statistics ● Released 6/15

Health Insurance Coverage: Early Release of Estimates From the National Health Interview Survey, 2014
Table 15. Percentages of persons in states who lacked health insurance coverage, had public health plan coverage, or had private
health insurance coverage at the time of interview, by age group: United States, 2014
Age group and selected states
1
Uninsured
2
at the time of
interview
Public health plan
coverage
3
Private health insurance
coverage
4
Percent (standard error)
All ages
All states
5
11.5 (0.20) 34.6 (0.33) 61.8 (0.38)
Alabama 9.8 (1.48) 38.7 (2.68) 62.0 (3.02)
Alaska 19.4 (1.99) 28.6 (2.52) 58.9 (3.09)
Arizona 14.6 (1.50) 38.2 (2.30) 52.9 (2.66)
Arkansas 10.9 (1.56) 36.6 (2.67) 61.6 (3.04)
California 12.0 (0.51) 34.9 (0.88) 57.5 (1.09)
Colorado 9.5 (1.28) 27.5 (2.16) 70.7 (2.49)
Connecticut 7.0 (1.25) 35.9 (2.60) 64.1 (2.94)
Delaware 4.4 (1.01) 38.2 (2.65) 68.5 (2.86)
District of Columbia 3.0 (0.87) 39.7 (2.78) 64.3 (3.07)
Florida 15.3 (1.00) 39.4 (1.61) 51.8 (1.31)
Georgia 14.2 (1.44) 33.5 (1.32) 58.1 (1.80)
Hawaii *2.0 (0.69) 43.9 (2.73) 69.2 (2.86)
Idaho 13.3 (1.51) 29.6 (2.25) 66.5 (2.63)
Illinois 10.3 (0.96) 34.2 (1.57) 66.0 (1.77)
Indiana 12.0 (1.41) 32.7 (2.25) 64.7 (2.59)
Iowa 5.6 (0.96) 29.3 (2.10) 75.0 (2.26)
Kansas 9.0 (1.16) 33.1 (2.12) 70.1 (2.33)
Kentucky 10.9 (1.35) 43.8 (2.38) 53.0 (2.70)
Louisianna 12.9 (1.49) 38.1 (2.39) 55.9 (2.76)
Maine 11.3 (1.42) 36.9 (2.40) 60.9 (2.74)
Maryland 7.9 (1.27) 34.6 (2.48) 67.1 (2.77)
Massachusetts 2.6 (0.72) 38.7 (2.46) 71.0 (2.59)
Michigan 8.0 (0.99) 35.5 (1.96) 67.7 (2.44)
Minnesota 5.7 (1.06) 27.4 (2.26) 76.3 (2.43)
Mississippi 14.9 (1.66) 38.5 (2.52) 56.4 (2.90)
Missouri 12.4 (1.53) 30.9 (2.38) 65.3 (2.77)
Montana 11.2 (1.60) 42.0 (2.77) 61.5 (3.09)
Nebraska 11.2 (1.40) 31.1 (2.28) 66.4 (2.62)
Nevada 15.0 (1.58) 32.8 (2.31) 57.8 (2.75)
New Hampshire 8.0 (1.26) 28.8 (2.33) 74.5 (2.54)
New Jersey 9.4 (1.13) 27.1 (1.90) 72.9 (2.15)
New Mexico 11.3 (1.49) 49.5 (2.61) 49.2 (2.95)
New York 9.4 (0.77)
39.9 (1.41) 57.5 (1.60)
North Carolina 14.8 (1.17) 38.0 (1.73) 54.9 (2.61)
North Dakota 6.0 (1.13) 27.0 (2.34) 79.4 (2.41)
Ohio 7.6 (0.65) 37.3 (1.70) 64.6 (1.87)
Oklahoma 18.1 (1.64) 39.1 (2.30) 50.0 (2.66)
Oregon 8.8 (1.29) 41.0 (2.50) 58.8 (2.82)
Pennsylvania 7.9 (0.84) 34.2 (1.92) 69.8 (1.58)
Rhode Island 6.4 (1.13) 31.2 (2.36) 70.2 (2.63)
South Carolina 14.5 (1.71) 39.7 (2.64) 53.5 (3.04)
South Dakota 8.5 (1.27) 31.5 (2.35) 72.4 (2.55)
Tennessee 10.8 (1.42) 36.9 (2.44) 60.1 (2.80)
Texas 19.4 (0.76) 28.3 (0.99) 57.2 (1.31)
Utah 12.9 (1.32) 22.4 (1.82) 73.1 (2.19)
Vermont 8.6 (1.49) 33.6 (2.79) 66.8 (3.14)
Virginia 10.8 (1.30) 31.3 (2.15) 67.0 (2.46)
Washington 9.8 (1.24) 31.7 (2.15) 66.0 (2.47)
West Virginia 7.6 (1.21) 43.0 (2.50) 59.6 (2.80)
Wisconsin 6.3 (1.17) 33.7 (2.53) 73.5 (2.67)
Wyoming 10.9 (1.49) 20.9 (2.16) 75.3 (2.59)
See footnotes at end of table.
Page | 24 U.S. Department of Health and Human Services ● Centers for Disease Control and Prevention ● National Center for Health Statistics ● Released 6/15

Health Insurance Coverage: Early Release of Estimates From the National Health Interview Survey, 2014
Table 15. Percentages of persons in states who lacked health insurance coverage, had public health plan coverage, or had private
health insurance coverage at the time of interview, by age group: United States, 2014 —Continued
Age group and selected states
1
Uninsured
2
at the time of
interview
Public health plan
coverage
3
Private health insurance
coverage
4
Percent (standard error)
Under 65 years
All states
5
13.3 (0.22) 24.5 (0.33) 63.6 (0.41)
Alabama 11.8 (1.74) 28.0 (2.77) 63.4 (3.38)
Alaska 21.2 (2.19) 22.2 (2.54) 58.6 (3.43)
Arizona 16.9 (1.70) 28.7 (2.34) 55.9 (2.93)
Arkansas 12.7 (1.80) 25.9 (2.71) 62.7 (3.41)
California 13.4 (0.56) 26.8 (0.93) 60.6 (1.18)
Colorado 10.7 (1.42) 18.4 (2.04) 71.8 (2.70)
Connecticut 8.0 (1.42) 25.6 (2.62) 67.2 (3.21)
Delaware 5.4 (1.21) 25.7 (2.68) 70.6 (3.18)
District of Columbia 3.3 (0.98) 32.4 (2.92) 64.7 (3.40)
Florida 18.8 (1.11) 26.0 (1.41) 55.9 (1.47)
Georgia 16.1 (1.65) 24.7 (1.41) 59.8 (2.05)
Hawaii *2.5 (0.87) 26.1 (2.81) 72.8 (3.24)
Idaho 15.2 (1.72) 19.7 (2.18) 66.6 (2.94)
Illinois 12.0 (1.13) 24.3 (1.79) 65.5 (1.92)
Indiana 13.8 (1.60) 22.9 (2.23) 64.5 (2.89)
Iowa 6.4 (1.10) 18.8 (2.00) 76.4 (2.47)
Kansas 10.8 (1.37) 19.5 (2.00) 71.8 (2.59)
Kentucky 12.5 (1.53) 36.0 (2.53) 53.3 (3.00)
Louisianna 15.2 (1.73) 27.5 (2.46) 58.4 (3.09)
Maine 13.8 (1.72) 24.2 (2.44) 63.9 (3.12)
Maryland 9.3 (1.46) 24.8 (2.47) 67.3 (3.06)
Massachusetts 3.2 (0.87) 25.8 (2.47) 72.2 (2.88)
Michigan 9.3 (1.12) 25.0 (1.99) 67.5 (2.70)
Minnesota 6.5 (1.19) 18.6 (2.14) 76.7 (2.65)
Mississippi 18.0 (1.95) 26.2 (2.55) 57.9 (3.27)
Missouri 14.2 (1.75) 20.0 (2.29) 67.2 (3.07)
Montana 14.6 (2.01) 24.9 (2.82) 63.5 (3.58)
Nebraska 12.8 (1.63) 20.8 (2.25) 67.6 (2.96)
Nevada 17.6 (1.82) 21.3 (2.24) 63.1 (3.01)
New Hampshire 9.5 (1.52) 14.9 (2.11) 76.9 (2.84)
New Jersey 10.8 (1.28) 15.8 (1.71) 74.4 (2.34)
New Mexico 14.0 (1.82) 37.4 (2.89) 50.5 (3.41)
New York 11.0 (0.89)
30.3 (1.47) 60.0 (1.77)
North Carolina 17.3 (1.30) 28.2 (1.98) 56.2 (2.93)
North Dakota 7.3 (1.35) 10.6 (1.82) 84.1 (2.47)
Ohio 8.9 (0.78) 26.3 (1.86) 66.6 (2.06)
Oklahoma 21.5 (1.91) 28.3 (2.39) 52.0 (3.02)
Oregon 10.7 (1.56) 28.5 (2.60) 62.3 (3.18)
Pennsylvania 9.5 (1.02) 21.0 (1.48) 70.8 (1.83)
Rhode Island 7.4 (1.28) 22.1 (2.32) 73.1 (2.82)
South Carolina 17.1 (1.97) 29.3 (2.72) 54.4 (3.40)
South Dakota 10.4 (1.50) 17.9 (2.15) 72.7 (2.85)
Tennessee 12.5 (1.61) 27.3 (2.48) 62.1 (3.08)
Texas 21.5 (0.83) 20.4 (0.87) 59.0 (1.38)
Utah 14.4 (1.46) 13.2 (1.61) 74.6 (2.36)
Vermont 9.8 (1.74) 25.6 (2.91) 65.3 (3.62)
Virginia 12.5 (1.49) 20.7 (2.08) 68.3 (2.73)
Washington 10.9 (1.37) 23.3 (2.12) 67.3 (2.68)
West Virginia 9.0 (1.42) 33.4 (2.67) 59.9 (3.17)
Wisconsin 7.5 (1.39) 20.4 (2.42) 74.7 (2.98)
Wyoming 11.9 (1.64) 13.5 (1.97) 76.3 (2.80)
See footnotes at end of table.
Page | 25 U.S. Department of Health and Human Services ● Centers for Disease Control and Prevention ● National Center for Health Statistics ● Released 6/15

Health Insurance Coverage: Early Release of Estimates From the National Health Interview Survey, 2014
Table 15. Percentages of persons in states who lacked health insurance coverage, had public health plan coverage, or had private
health insurance coverage at the time of interview, by age group: United States, 2014 —Continued
Age group and selected states
1
Uninsured
2
at the time of
interview
Public health plan
coverage
3
Private health insurance
coverage
4
Percent (standard error)
18–64 years
All states
5
16.3 (0.26) 17.7 (0.29) 67.3 (0.37)
Alabama 14.8 (2.05) 20.7 (2.46) 68.3 (3.10)
Alaska 24.6 (1.69) 14.2 (2.05) 63.3 (3.11)
Arizona 19.5 (1.01) 22.4 (2.22) 59.4 (2.87)
Arkansas 15.6 (2.50) 17.7 (2.31) 68.0 (3.10)
California 16.7 (0.67) 20.4 (0.77) 63.9 (1.10)
Colorado 13.3 (1.43) 12.3 (1.74) 75.1 (2.52)
Connecticut 10.0 (2.55) 20.5 (2.35) 70.3 (2.91)
Delaware *6.0 (2.23) 20.2 (2.35) 74.8 (2.79)
District of Columbia † 27.1 (2.63) 69.6 (2.99)
Florida 23.0 (1.34) 16.9 (1.20) 61.0 (1.32)
Georgia 20.2 (2.21) 16.5 (1.28) 64.3 (1.96)
Hawaii † 22.0 (2.56) 76.2 (2.89)
Idaho 21.9 (1.81) 10.4 (1.71) 68.9 (2.84)
Illinois 15.0 (1.26) 17.4 (1.49) 69.2 (1.78)
Indiana 18.3 (2.09) 13.9 (1.84) 68.8 (2.70)
Iowa 8.4 (1.51) 13.1 (1.71) 79.2 (2.26)
Kansas 13.9 (1.87) 12.8 (1.71) 75.0 (2.43)
Kentucky 15.6 (2.00) 29.5 (2.35) 56.6 (2.80)
Louisianna 18.9 (2.16) 20.0 (2.14) 62.1 (2.85)
Maine 16.9 (0.95) 18.4 (2.11) 66.1 (2.82)
Maryland 12.3 (2.13) 18.7 (2.23) 70.9 (2.85)
Massachusetts *3.8 (1.84) 23.7 (2.32) 73.8 (2.63)
Michigan 11.6 (1.30) 19.9 (1.82) 69.8 (2.61)
Minnesota 8.0 (1.52) 13.5 (1.86) 79.4 (2.42)
Mississippi 22.4 (1.57) 17.0 (2.14) 63.0 (3.02)
Missouri 16.9 (1.97) 14.0 (1.94) 70.4 (2.80)
Montana 18.0 (1.81) 19.9 (2.55) 64.8 (3.35)
Nebraska 16.9 (2.14) 10.4 (1.69) 73.9 (2.67)
Nevada 20.4 (1.86) 15.0 (1.94) 66.4 (2.81)
New Hampshire 11.6 (2.07) 9.4 (1.63) 80.5 (2.43)
New Jersey 12.9 (1.44) 11.9 (1.47) 76.3 (2.12)
New Mexico 18.7 (2.36) 27.6 (2.65) 55.7 (3.22)
New York 12.9 (0.90)
25.1 (1.42) 63.3 (1.72)
North Carolina 22.5 (1.84) 16.9 (1.70) 62.5 (2.69)
North Dakota 9.3 (1.92) 8.7 (1.61) 83.7 (2.31)
Ohio 10.9 (0.91) 21.3 (1.52) 69.6 (1.87)
Oklahoma 26.6 (1.78) 19.2 (2.09) 55.8 (2.88)
Oregon 13.3 (2.00) 21.3 (2.28) 67.1 (2.87)
Pennsylvania 11.9 (1.20) 13.8 (1.45) 75.6 (1.73)
Rhode Island 9.0 (1.75) 18.3 (2.13) 74.7 (2.63)
South Carolina 21.0 (2.03) 22.9 (2.43) 57.7 (3.13)
South Dakota 13.4 (1.32) 11.9 (1.81) 75.8 (2.63)
Tennessee 14.8 (2.10) 20.5 (2.22) 66.8 (2.84)
Texas 25.7 (1.03) 11.7 (0.66) 63.5 (1.19)
Utah 16.2 (1.78) 10.5 (1.51) 75.0 (2.35)
Vermont 9.1 (1.24) 21.1 (2.64) 70.0 (3.25)
Virginia 15.2 (1.66) 15.6 (1.81) 70.9 (2.49)
Washington 13.3 (1.77) 16.7 (1.86) 71.2 (2.47)
West Virginia 12.2 (2.05) 27.8 (2.47) 62.7 (2.92)
Wisconsin 8.7 (1.91) 14.1 (2.04) 78.4 (2.65)
Wyoming 15.2 (1.63) 10.0 (1.71) 76.3 (2.66)
See footnotes at end of table.
Page | 26 U.S. Department of Health and Human Services ● Centers for Disease Control and Prevention ● National Center for Health Statistics ● Released 6/15

Health Insurance Coverage: Early Release of Estimates From the National Health Interview Survey, 2014
Table 15. Percentages of persons in states who lacked health insurance coverage, had public health plan coverage, or had private
health insurance coverage at the time of interview, by age group: United States, 2014 —Continued
Age group and selected states
1
Uninsured
2
at the time of
interview
Public health plan
coverage
3
Private health insurance
coverage
4
Percent (standard error)
0–17 years
All states 5.5 (0.23) 42.2 (0.61) 53.7 (0.65)
Alabama *3.8 (1.68) 47.2 (5.24) 50.5 (5.36)
Arizona 11.2 (2.13) 42.1 (3.98) 48.6 (4.11)
California 5.0 (0.58) 43.3 (1.69) 52.3 (1.70)
Colorado *4.2 (1.44) 33.1 (4.01) 63.8 (4.18)
Florida 6.6 (1.03) 52.3 (2.62) 41.4 (2.56)
Georgia 5.5 (0.94) 45.9 (2.99) 48.3 (2.95)
Idaho *3.5 (1.33) 36.1 (4.14) 62.6 (4.26)
Illinois *3.6 (1.26) 43.2 (3.30) 55.1 (3.15)
Indiana 3.3 (1.31) 43.9 (4.31) 54.5 (4.41)
Iowa 1.7 (0.92) 32.5 (4.01) 69.8 (4.01)
Kansas 4.5 (1.40) 33.5 (3.82) 64.8 (3.94)
Kentucky 4.1 (1.52) 53.6 (4.57) 44.3 (4.65)
Louisianna 4.5 (1.69) 49.5 (4.86) 47.8 (4.96)
Maine 3.7 (1.67) 42.9 (5.26) 56.8 (5.37)
Maryland 1.9 (1.08) 39.6 (4.65) 58.7 (4.78)
Massachusetts 1.3 (0.96) 32.6 (4.78) 67.3 (4.88)
Michigan 3.3 (1.06) 38.2 (3.46) 61.3 (4.01)
Minnesota 2.6 (1.25) 31.8 (4.31) 69.8 (4.34)
Mississippi 5.6 (1.92) 52.2 (4.98) 43.7 (5.05)
Missouri 6.0 (2.01) 38.3 (4.90) 57.2 (5.09)
Nebraska *3.5 (1.41) 44.6 (4.57) 53.2 (4.68)
Nevada 10.1 (2.33) 37.9 (4.46) 54.1 (4.68)
New Jersey *4.3 (1.43) 27.9 (3.77) 68.5 (3.99)
New Mexico *3.3 (1.51) 60.0 (4.94) 38.5 (5.01)
New York 5.1 (1.38) 46.4 (2.62) 49.5 (2.85)
North Carolina 5.6 (1.18) 53.7 (3.61) 41.9 (3.83)
Ohio *3.4 (1.10) 40.3 (3.65) 58.1 (3.45)
Oklahoma 10.1 (2.22) 48.5 (4.37) 43.7 (4.43)
Oregon *3.0 (1.49) 49.7 (5.19) 48.2 (5.30)
Pennsylvania *2.4 (0.97) 42.3 (3.16) 56.5 (3.18)
Rhode Island *3.2 (1.40) 31.7 (4.41) 68.9 (4.48)
South Dakota *2.9 (1.31) 32.9 (4.36) 64.9 (4.52)
Tennessee *6.4 (1.94)
44.8 (4.70) 49.9 (4.82)
Texas 11.7 (0.93) 40.5 (2.12) 48.8 (2.24)
Utah 11.1 (1.91) 18.2 (2.79) 73.8 (3.25)
Virginia *4.4 (1.58) 36.0 (4.38) 60.6 (4.55)
Washington *4.3 (1.43) 41.2 (4.13) 56.5 (4.25)
West Virginia † 47.7 (4.99) 52.9 (5.09)
Wisconsin *4.0 (1.71) 38.7 (5.09) 63.6 (5.13)
Wyoming *4.9 (1.79) 20.8 (3.99) 76.1 (4.28)
* Estimate has a relative standard error (RSE) greater than 30% and less than or equal to 50% and should be used with caution as it does not meet standards of reliability or precision.
†Estimate has an RSE of greater than 50% and is not shown.
1
Estimates are presented for fewer than 50 states and the District of Columbia for children aged 0–17 due to considerations of sample size and precision.
2
A person was defined as uninsured if he or she did not have any private health insurance, Medicare, Medicaid, Children’s Health Insurance Program (CHIP), state-sponsored or other
government-sponsored health plan, or military plan. A person was also defined as uninsured if he or she had only Indian Health Service coverage or had only a private plan that paid
for one type of service, such as accidents or dental care.
3
Includes Medicaid, Children’s Health Insurance Program (CHIP), state-sponsored or other government-sponsored health plan, Medicare, and military plans. A small number of
persons were covered by both public and private plans and were included in both categories.
4
Includes any comprehensive private insurance plan (including health maintenance and preferred provider organizations). These plans include those obtained through an employer,
purchased directly, or purchased through local or community programs. Private cove rage excludes plans that pay for only one type of service, such as accidents or dental care. A small
number of persons were covered by both public and private plans and were include d in both categories.
5
Includes all 50 states and the District of Columbia.
NOTE: Data are based on household interviews of a sample of the civilian noninstitutionalized population.
DATA SOURCE: CDC/NCHS, National He alth Interview Survey, 2014, Family Cor e component.
Page | 27 U.S. Department of Health and Human Services ● Centers for Disease Control and Prevention ● National Center for Health Statistics ● Released 6/15

Health Insurance Coverage: Early Release of Estimates From the National Health Interview Survey, 2014
Technical Notes
The Centers for Disease Control and
Prevention’s (CDC) National Center for
Health Statistics (NCHS) is releasing
selected estimates of health insurance
coverage for the civilian
noninstitutionalized U.S. population
based on data from the 2014 National
Health Interview Survey (NHIS), along
with comparable estimates from the
2009–2013 NHIS.
To reflect different policy-relevant
perspectives, three measures of lack of
health insurance coverage are provided:
(a) uninsured at the time of interview,
(b) uninsured at least part of the year
prior to interview (which also includes
persons uninsured for more than a year),
and (c) uninsured for more than a year at
the time of interview. The three time
frames are defined as:
Uninsured at the time of interview
provides an estimate of persons who
at any given time may have
experienced barriers to obtaining
needed health care.
Uninsured at any time in the year prior
to interview provides an annual
caseload of persons who may
experience barriers to obtaining
needed health care. This measure
includes persons who have insurance
at the time of interview but who had
a period of noncoverage in the year
prior to interview, as well as those
who are currently uninsured and
who may have been uninsured for a
long period of time.
Uninsured for more than a year
provides an estimate of those with a
persistent lack of coverage who may
be at high risk of not obtaining
preventive services or care for illness
and injury.
These three measures are not
mutually exclusive, and a given individual
may be counted in more than one of the
measures. Estimates of enrollment in
public and private coverage are also
provided.
This report also includes estimates
for three types of consumer-directed
private health care. Consumer-directed
health care may enable individuals to
have more control over when and how
they access care, what types of care they
use, and how much they spend on health
care services. National attention to
consumer-directed health care increased
following enactment of the Medicare
Prescription Drug Improvement and
Modernization Act of 2003 (P.L. 108–
173), which established tax-advantaged
health savings accounts (HSAs) (1). In
2007, three new questions were added to
the health insurance section of NHIS to
monitor enrollment in consumer-
directed health care among persons with
private health insurance. Estimates are
provided for enrollment in high-
deductible health plans (HDHPs), plans
with high deductibles coupled with HSAs
(i.e., consumer-directed health plans or
CDHPs), and being in a family with a
flexible spending account (FSA) for
medical expenses not otherwise covered.
For a more complete description of
consumer-directed health care, see
“Definitions of selected terms” below.
The 2014 health insurance
estimates are being released prior to final
data editing and final weighting, to
provide access to the most recent
information from NHIS. Differences
between estimates calculated using
preliminary data files and final data files
are typically less than 0.1 percentage
point. However, preliminary estimates of
persons without health insurance
coverage are generally 0.1–0.3 percentage
points lower than the final estimates due
to the editing procedures used for the
final data files.
Estimates for 2014 are stratified by
age group, sex, race/ethnicity, poverty
status, marital status, employment
status, region, and educational
attainment.
Data source
NHIS is a multistage probability
sample survey of the civilian
noninstitutionalized population of the
United States and is the source of data
for this report. The survey is conducted
continuously throughout the year by
NCHS through an agreement with the
U.S. Census Bureau.
NHIS is a comprehensive health
survey that can be used to relate health
insurance coverage to health outcomes
and health care utilization. It has a low
item nonresponse rate (about 1%) for the
health insurance questions. Because
NHIS is conducted throughout the year—
yielding a nationally representative
sample each month—data can be
analyzed monthly or quarterly to monitor
health insurance coverage trends.
The fundamental structure of the
current NHIS oversamples Hispanic,
black, and Asian populations. Visit the
NCHS website at:
http://www.cdc.gov/nchs/nhis.htm for
more information on the design, content,
and use of NHIS.
The data for this report are derived
from the Family Core component of the
2009–2014 NHIS, which collects
information on all family members in
each household. Data analyses for the
2014 NHIS were based on 111,682
persons in the Family Core.
Data on health insurance status
were edited using an automated system
based on logic checks and keyword
searches. Information from follow-up
questions, such as plan name(s), were
used to reassign insurance status and
type of coverage to avoid
misclassification. For comparability, the
estimates for all years were created using
these same procedures. The analyses
excluded persons with unknown health
insurance status (about 1% of
respondents each year).
Estimation procedures
NCHS creates survey weights for
each calendar quarter of the NHIS
sample. The NHIS data weighting
procedure is described in more detail at:
http://www.cdc.gov/nchs/data/series/sr_
02/sr02_165.pdf. Estimates were
calculated using NHIS survey weights,
which are calibrated to census totals for
sex, age, and race/ethnicity of the U.S.
civilian noninstitutionalized population.
Weights for 2009–2011 were derived
from 2000 census-based population
estimates. Beginning with 2012 NHIS
data, weights were derived from 2010
census-based population estimates.
Point estimates and estimates of
their variances were calculated using
SUDAAN software (RTI International,
Research Triangle Park, N.C.) to account
for the complex sample design of NHIS,
taking into account stratum and primary
sampling unit (PSU) identifiers. The
Page | 28 U.S. Department of Health and Human Services ● Centers for Disease Control and Prevention ● National Center for Health Statistics ● Released 6/15

Health Insurance Coverage: Early Release of Estimates From the National Health Interview Survey, 2014
Taylor series linearization method was
chosen for variance estimation.
Trends in coverage were generally
assessed using Joinpoint regression (2),
which characterizes trends as joined
linear segments. A Joinpoint is the year
where two segments with different slopes
meet. Joinpoint software uses statistical
criteria to determine the fewest number
of segments necessary to characterize a
trend and the year(s) when segments
begin and end. Trends from 2010 to 2014
were also evaluated using logistic
regression analysis.
State-specific health insurance
estimates are presented for all 50 states
and the District of Columbia for persons
of all ages, persons under age 65, and
adults aged 18–64. State-specific
estimates are presented for 40 states for
children aged 0–17. Estimates are not
presented for all 50 states and the
District of Columbia for children due to
considerations of sample size and
precision. All states had at least 1,000
interviews for persons of all ages.
Estimates for children in states that did
not have at least 300 children with
completed interviews are not presented.
For the 10 states with the largest
populations (California, Florida, Georgia,
Illinois, Michigan, New York, North
Carolina, Ohio, Pennsylvania, and Texas),
standard errors (SEs) were calculated
using SUDAAN. Because of small sample
sizes and limitations in the NHIS design,
similarly estimated SEs for other states
could be statistically unstable or
negatively biased; consequently, for
states other than the largest 10 states, an
estimated design effect was used to
calculate SEs. For this report, the design
effect, deff, of a percentage is the ratio of
the sampling variance of the percentage
(taking into account the complex NHIS
sample design) to the sampling variance
of the percentage from a simple random
sample (SRS) based on the same observed
number of persons.
Therefore, for each health insurance
measure and domain, SEs for smaller
states were calculated by multiplying the
SRS SE by A, where A is the average value
of the square root of deff over the 10
most populous states. Values of A ranged
from 1.55 for children who were
uninsured to 2.30 for persons under 65
with private coverage.
Calculation of SEs of the differences
between state and expanded regional
estimates and national estimates
accounted for correlations.
Unless otherwise noted, all
estimates shown meet the NCHS
standard of having less than or equal to
30% relative standard error. Differences
between percentages or rates were
evaluated using two-sided significance
tests at the 0.05 level. All differences
discussed are significant unless otherwise
noted. Lack of comment regarding the
difference between any two estimates
does not necessarily mean that the
difference was tested and found to be not
significant.
Definitions of selected terms
Private health insurance
coverage—Includes persons who had
any comprehensive private insurance
plan (including health maintenance and
preferred provider organizations). These
plans include those obtained through an
employer, purchased directly, purchased
through local or community programs, or
purchased through the Health Insurance
Marketplace or a state-based exchange.
Private coverage excludes plans that pay
for only one type of service, such as
accidents or dental care.
Public health plan coverage—
Includes Medicaid, Children’s Health
Insurance Program (CHIP), state-
sponsored or other government-
sponsored health plans, Medicare, and
military plans. A small number of persons
were covered by both public and private
plans and were included in both
categories.
Uninsured—A person was defined
as uninsured if he or she did not have any
private health insurance, Medicare,
Medicaid, CHIP, state-sponsored or other
government-sponsored health plan, or
military plan at the time of interview. A
person was also defined as uninsured if
he or she had only Indian Health Service
coverage or had only a private plan that
paid for one type of service, such as
accidents or dental care.
Directly purchased coverage—
Private insurance that was originally
obtained through direct purchase or
other means not related to employment.
Employment-based coverage—
Private insurance that was originally
obtained through a present or former
employer or union or a professional
association.
Exchange-based coverage—A
private health insurance plan purchased
through the Health Insurance
Marketplace or state-based exchanges
that were established as part of the
Affordable Care Act (ACA). of 2010 (P.L.
111–148, P.L. 111–152) In response to
ACA, several new questions were added
to NHIS to capture health care plans
obtained through exchange-based
coverage.
In general, if a family member is
reported to have coverage through the
exchange, that report is considered
accurate unless there is other
information (e.g., plan name or
information about premiums) that
clearly contradicts that report. Similarly,
if a family member is not reported to
have coverage through the exchange, that
report is considered accurate unless there
is other information that clearly
contradicts that report. For a more
complete discussion of the procedures
used in the classification of exchange-
based coverage, see
http://www.cdc.gov/nchs/nhis/insurance
.htm.
Based on these classification
procedures, an average of 2.2% (SE, 0.10)
of persons under age 65, 2.7% (SE, 0.11)
of adults aged 18–64, 0.9% (SE, 0.11) of
children under age 18, and 1.9% (SE,
0.17) of adults aged 19–25, had
exchange-based private health insurance
coverage in 2014. This equates to 5.9
million persons under age 65 and 5.2
million adults aged 18–64, 0.7 million
children, and 0.6 million adults aged 19–
25. If these procedures had not been used
and reports of coverage through the
exchanges (or lack thereof) had been
taken at face value, the estimate would
have been higher. For example, an
average of 3.0% (7.9 million) of persons
under age 65 would have been reported
to have obtained their coverage through
exchanges over the full year of 2014.
High-deductible health plan
(HDHP)—For persons with priva
te
health insurance, a question was asked
regarding the annual deductible of each
private health insurance plan. An HDHP
was defined in 2013 and 2014 as a
private health plan with an annual
Page | 29 U.S. Department of Health and Human Services ● Centers for Disease Control and Prevention ● National Center for Health Statistics ● Released 6/15

Health Insurance Coverage: Early Release of Estimates From the National Health Interview Survey, 2014
deductible of at least $1,250 for self-only
coverage or $2,500 for family coverage.
The deductible is adjusted annually for
inflation. For 2010 through 2012, the
annual deductible for self-only coverage
was $1,200 and for family coverage was
$2,400. For 2009, the annual deductible
for self-only coverage was $1,150 and for
family coverage was $2,300.
Consumer-directed health plan
(CDHP)—Defined as an HDHP with a
special account to pay for medical
expenses. Unspent funds are carried over
to subsequent years. For plans considered
to be HDHPs, a follow-up question was
asked regarding these special accounts. A
person is considered to have a CDHP if
there was a “yes” response to the
following question: With this plan, is there
a special account or fund that can be used to
pay for medical expenses? The accounts are
sometimes referred to as Health Savings
Accounts (HSAs), Health Reimbursement
Accounts (HRAs), Personal Care accounts,
Personal Medical funds, or Choice funds,
and are different from Flexible Spending
Accounts.
Health savings account (HSA)—
A tax-advantaged account or fund that
can be used to pay for medical expenses.
It must be coupled with an HDHP. The
funds contributed to the account are not
subject to federal income tax at the time
of deposit. Unlike FSAs, HSA funds roll
over and accumulate year to year if not
spent. HSAs are owned by the individual.
Funds may be used to pay for qualified
medical expenses at any time without
federal tax liability. HSAs may also be
referred to as Health Reimbursement
Accounts (HRAs), Personal Care
accounts, Personal Medical funds, or
Choice funds, and the term “HSA” in this
report includes accounts that use these
alternative names.
Flexible spending account (FSA)
for medical expenses—A person is
considered to be in a family with an FSA
if there was a “yes” response to the
following question: [Do you/Does anyone
in your family] have a Flexible Spending
Account for health expenses? These accounts
are offered by some employers to allow
employees to set aside pretax dollars of their
own money for their use throughout the year
to reimburse themselves for their out-of-
pocket expenses for health care. With this
type of account, any money remaining in the
account at the end of the year, following a
short grace period, is lost to the employee.
The measures of HDHP enrollment,
CDHP enrollment, and being in a family
with an FSA for medical expenses are not
mutually exclusive; a person may be
counted in more than one measure.
Medicaid expansion status—
Under provisions of the Affordable Care
Act (ACA) of 2010 (P.L. 111–148, P.L.
111–152), states have the option to
expand Medicaid eligibility to cover
adults who have income up to and
including 138% of the federal poverty
level. There is no deadline for states to
choose to implement the Medicaid
expansion, and they may do so at any
time. As of October 31, 2013, 26 states
and the District of Columbia are moving
forward with Medicaid expansion.
Health Insurance Marketplace—
A resource where individuals, families,
and small businesses can learn about
their health coverage options; compare
health insurance plans based on cost,
benefits, and other important features;
choose a plan; and enroll in coverage. The
marketplace also provides information
on programs that help people with low-
to-moderate income and resources pay
for coverage. There are three types of
Health Insurance Marketplaces: (a) a
State-based Marketplace set up and
operated solely by the state; (b) a hybrid
Partnership Marketplace in which the
state runs certain functions and makes
key decisions and may tailor the
marketplace to local needs and market
conditions, but which is operated by the
federal government; and (c) the Federally
Facilitated Marketplace operated solely
by the federal government.
Education—The categories of
education are based on the years of
school completed or highest degree
obtained for persons aged 18 and over.
Employment—Employment status
is assessed at the time of interview and is
obtained for persons aged 18 and over. In
this release, it is presented only for
persons aged 18–64.
Hispanic or Latino origin and
race—Hispanic or Latino origin and race
are two separate and distinct categories.
Persons of Hispanic or Latino origin may
be of any race or combination of races.
Hispanic or Latino origin includes
persons of Mexican, Puerto Rican, Cuban,
Central and South American, or Spanish
origin. Race is based on the family
respondent’s description of his or her
own race background, as well as the race
background of other family members.
More than one race may be reported for a
person. For conciseness, the text, tables,
and figures in this report use shorter
versions of the 1997 Office of
Management and Budget (OMB) terms
for race and Hispanic or Latino origin.
For example, the category “Not Hispanic
or Latino, black or African American,
single race” is referred to as “non-
Hispanic black, single race” in the text,
tables, and figures. Estimates for non-
Hispanic persons of races other than
white only, black only, and Asian only, or
of multiple races, are combined into the
“Other races and multiple races”
category.
Poverty status—Poverty
categories are based on the ratio of the
family’s income in the previous calendar
year to the appropriate poverty threshold
(given the family’s size and number of
children) defined by the U.S. Census
Bureau for that year (3–8). Persons
categorized as “Poor” have a ratio less
than 1.0 (i.e., their family income was
below the poverty threshold); “Near-
poor” persons have incomes of 100% to
less than 200% of the poverty threshold;
and “Not-poor” persons have incomes
that are 200% of the poverty threshold or
greater. The remaining group of
respondents is coded as “Unknown” with
respect to poverty status. The percentage
of respondents with unknown poverty
status (12.3% in 2009, 12.2% in 2010,
11.5% in 2011, 11.4% in 2012, 10.2% in
2013, and 8.8% in 2014) is disaggregated
by age and insurance status in Tables 4,
5, and 6.
For more information on unknown
income and unknown poverty status, see
the NHIS Survey Description document
for 2009–2013 (available from:
http://www.cdc.gov/nchs/nhis/quest_
data_related_1997_forward.htm).
NCHS imputes income for
approximately 30% of NHIS records. The
imputed income files are released a few
months after the annual release of NHIS
microdata and are not available for the
ER updates. Therefore, ER health
insurance estimates stratified by poverty
status are based on reported income only
Page | 30 U.S. Department of Health and Human Services ● Centers for Disease Control and Prevention ● National Center for Health Statistics ● Released 6/15

Health Insurance Coverage: Early Release of Estimates From the National Health Interview Survey, 2014
and may differ from similar estimates
produced later (e.g., in Health, United
States [9]) that are based on both
reported and imputed income.
Region—In the geographic
classification of the U.S. population,
states are grouped into the following four
regions used by the U.S. Census Bureau:
Region States included
Northeast Maine, Vermont, New
Hampshire, Massachusetts,
Connecticut, Rhode Island,
New York, New Jersey, and
Pennsylvania
Midwest Ohio, Illinois, Indiana,
Michigan, Wisconsin,
Minnesota, Iowa, Missouri,
North Dakota, South Dakota,
Kansas, and Nebraska
South Delaware, Maryland, District
of Columbia, West Virginia,
Virginia, Kentucky,
Tennessee, North Carolina,
South Carolina, Georgia,
Florida, Alabama,
Mississippi, Louisiana,
Oklahoma, Arkansas, and
Texas
West Washington, Oregon,
California, Nevada, New
Mexico, Arizona, Idaho,
Utah, Colorado, Montana,
Wyoming, Alaska, and
Hawaii
Expanded regions—Based on a
subdivision of the four regions into nine
divisions. For this report, the nine
Census divisions were modified by
moving Delaware, the District of
Columbia, and Maryland into the Middle
Atlantic division. This approach was used
previously by Holahan et al. (10).
Additional Early Release
Program Products
Two additional periodical reports
are published through the NHIS ER
Program. Early Release of Selected
Estimates Based on Data From the National
Health Interview Survey (11) is published
quarterly and provides estimates of 15
selected measures of health, including
insurance coverage. Other measures of
health include estimates of having a usual
place to go for medical care, obtaining
needed medical care, influenza
vaccination, pneumococcal vaccination,
obesity, leisure-time physical activity,
current smoking, alcohol consumption,
HIV testing, general health status,
personal care needs, serious psychological
distress, diagnosed diabetes, and asthma
episodes and current asthma.
Wireless Substitution: Early Release of
Estimates From the National Health
Interview Survey (12) is published in June
and December and provides selected
estimates of telephone coverage in the
United States.
Other ER reports and tabulations
on special topics are released on an as-
needed basis. See:
http://www.cdc.gov/nchs/nhis/
releases.htm.
In addition to these reports,
preliminary microdata files containing
selected NHIS variables are produced as
part of the ER Program. For each data
collection year (January through
December), these variables are made
available three times: about September
(with data from the first quarter), about
December (with data from the first two
quarters), and about March of the
following year (with data from the first
three quarters). NHIS data users can
analyze these files through the NCHS
Research Data Centers without having to
wait for the final annual NHIS microdata
files to be released.
New measures and products may be
added as work continues and in response
to changing data needs. Feedback on
these releases is welcome (e-mail).
Announcements about ERs, other
new data releases, and publications, as
well as corrections related to NHIS, will
be sent to members of the HISUSERS
electronic mailing list. To join, visit the
CDC website at:
http://www.cdc.gov/subscribe.html
and
click on the National Health Interview
Survey (NHIS) researchers button.
Suggested Citation
Cohen RA , Martinez ME. Health
insurance coverage: Early release of
estimates from the National Health
Interview Survey, 2014. National Center
for Health Statistics. June 2015.
Available from:
http://www.cdc.gov/nchs/nhis/
releases.htm.
Page | 31 U.S. Department of Health and Human Services ● Centers for Disease Control and Prevention ● National Center for Health Statistics ● Released 6/15
